Precision Pattern Trading: How Raymonds Delivered 20% in Just 2 Days
Jul 01, 2025
When one combines basic Price patterns with technical indicators like MACD (Moving Average Convergence Divergence) it leads to interesting results. Our recent analysis on Raymond Lifestyles Ltd, affirms this theory and by using this simple trade set up one can trade more confidently. Check out how this stock rallied by more than 20% after our prediction.
We published the following research on Raymond Lifestyle Ltd on 27th June 2025 in the “Vayu Momentum Report” which our subscribers receive pre-market every day.
Raymond Lifestyle Daily Chart Anticipated as on 27th June 2025 Raymond Lifestyle Daily Chart Happened as on 1st July 2025
 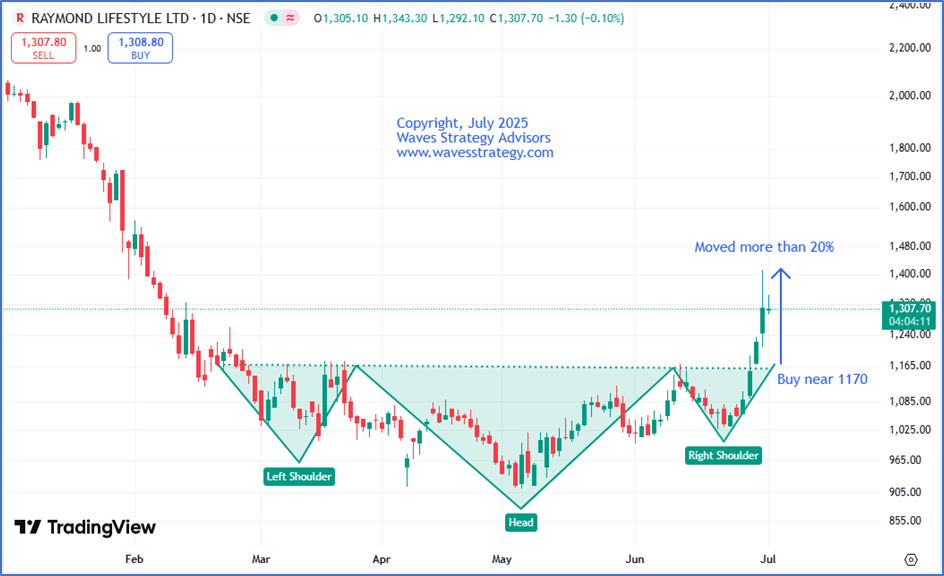 Wave analysis as on 27th June 2025-
In the previous session, RAYMONDLSL prices rose by nearly 6%, backed by a significant rise in the volumes which is the highest volume till the date. On the daily chart, over the past 6 trading sessions, the stock has shown a strong buying interest, with prices protecting a previous candle’s lows on a closing basis.
On the daily chart, the stock is forming an Inverse Head and Shoulder pattern, a classic reversal pattern, since February 2025. Although prices attempted to break out of it in the previous session but failed to give a close above the neckline of 1177 levels. So, a close above this level can confirm the pattern breakout and we can see upside movement. If this happens then according to the pattern target comes near 1340 levels which is length of the right shoulder.
Additionally, in the recent session, MACD has witnessed a bullish crossover as MACD line(blue) crossed above the signal line(red) working as a double confirmation for our stance. Post consecutive two days of rally, buying on dips looks like a prudent strategy.
In a nutshell, Overall tone for the stock is bullish. Post inverse H&S breakout upside strong rally is expected with the short-term targets’ of 1260 levels. On the downside, 1100 levels is the nearest support to watch out for!
Happened as on 01st July 2025:
Raymond Lifestyle has been in sync with our expectations. After a minor dip towards the neckline which we mentioned, prices reversed on the upside and BANG ON!! The stock moved as expected and not only achieved our both given target but also made a high of 1411 levels which suggests that bulls are increasing their stake in the stock. In the end, we were successful in capturing a move of more than 20% in just 2 trading sessions with the help of such simple price pattern and indicator.
It is fascinating to see how accurately Simple price patterns along with simple indicators can help to predict price targets with accuracy.
To know such short-term picks, subscribe to our Vayu Momentum report
Sutra of Waves – (Elliott wave with Neo wave) live session on 12th 13th July 2025 – You cannot miss learning this science completely and equip with such powerful forecasting methods that actually work. Neo wave is ultimate step towards trading successfully and missing element in your trade cycle. Limited seats only,
Trishul membership consists of Options Mantra, Elliott wave, Sutra of Wave. Fill below form