RBL BANK: Elliott Wave Signals Strong Up move
Feb 19, 2026
RBLBANK: Elliott Wave Signals Strong Up move
Beginners chase small moves, while experienced traders ride the strongest part of the trend. By aligning wave structure with price action, they filter noise and capture high-probability moves with confidence.
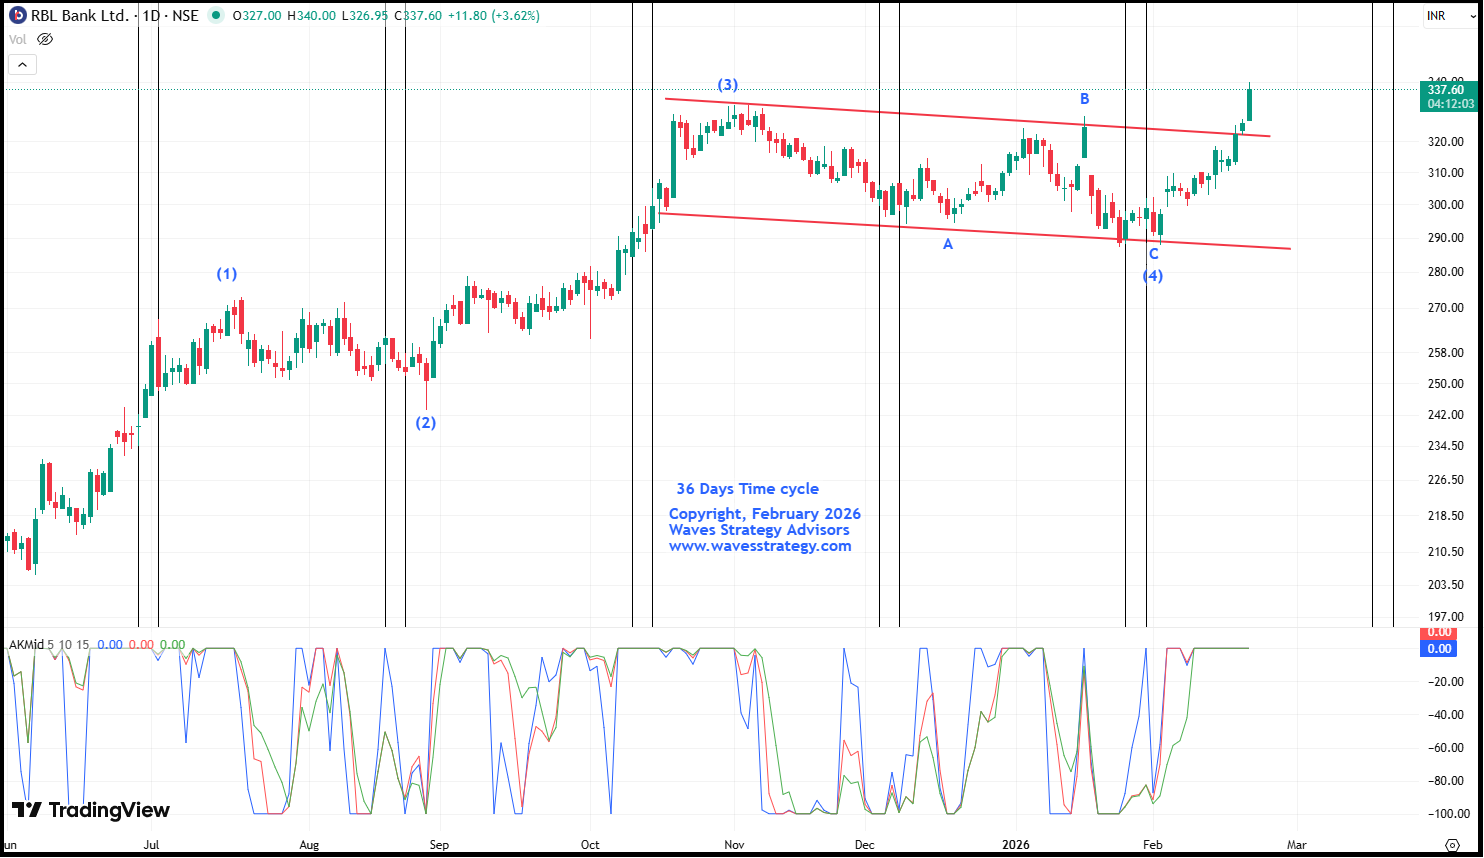
RBLBANK daily chart with AK Indicator, Time cycle & Elliot wave as on 19th February 2026
Elliott Wave provides a structured framework to evaluate both the direction and maturity of a market trend. When wave counts align with price action, it enhances conviction and improves the probability of capturing meaningful moves, even in individual stocks.
RBLBANK recently completed its corrective wave (4) on the downside on 2nd February 2026 in the form of Flat pattern (3-3-5) and currently the up move is ongoing in the form of wave (5). In which the recent rise is in the form of Intermediate wave 1 of wave (5).
Time cycle: The vertical line above plotted are 36 period Time cycle which has helped to capture the majority of the lows in RBL Bank. The recent low was made near 2nd February 2026 and the stock has rallied nearly 18% indicating the significance of the cycle.
AK Indicator: A custom-built tool designed to assess trend direction, momentum, and potential reversals. Currently, all three lines of the indicator are turning upward and moving above the zero line, signaling improving momentum and the continuation of the bullish move in the stock.
When price action aligns with Elliott wave analysis, it creates a powerful framework that allows traders to identify reversals early, with higher reward potential and controlled risk. This combination filters out noise and improves timing accuracy.
In a nutshell, Elliott wave combined with AK indicator, Price action, Time cycle helps a trader to analyze and create positions in any instrument with multiple confirmations. However, this sharp move has forced most of the oscillators in the overbought zone so buy on dips is the prudent strategy to go for. For now, one should use dips as an opportunity to ride the ongoing trend with support being around 322 and resistance being around 350.
Brahmastra Mentorship: Timing the Markets
A limited-seat mentorship program focused on:
- Basics to advanced technical analysis
- Elliott Wave & Neo Wave
- Time cycles
- Stock selection algorithms
- Complete understanding of chart patterns
- Exclusive mentorship sessions
- Simple, practical trade setups that actually work
Fill below form for more details