Reliance Trading Using Volume Profile – Is it BIG Trend start?
Nov 29, 2022
Like this Article? Share it with your friends!
Volume profile is different than normal Volumes that majority is tracking. Volume profile showcase behind the scenes big players activity and at which price point positions are created.
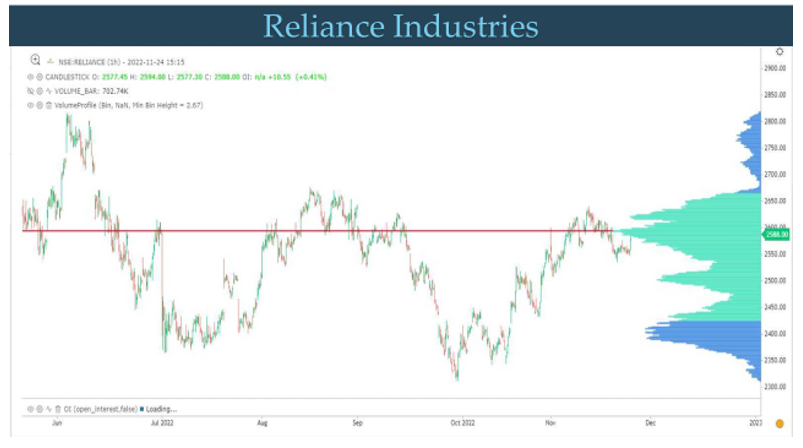
Below is the chart of Reliance Industries which we discussed during the Exclusive webinar on 27th November 2022.
Reliance hourly chart – Anticipated on 27th November 2022
 Reliance hourly chart - Happened
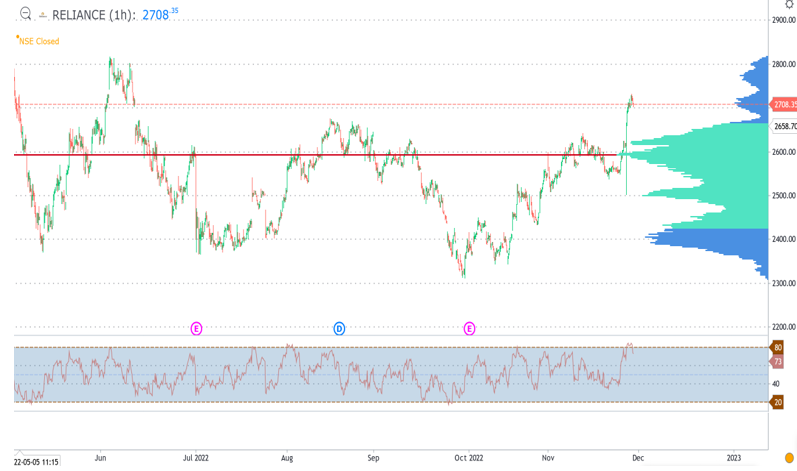
As seen in 1st chart, Reliance Industries approached the red line which is Volume point of Control (VPOC) that showed major accumulation took place near the zone of 2600 levels. As soon as this major Price action area was crossed there was sharp jump on upside and the stock rallied by nearly 4% in single day which is rare.
There are different shapes to Volume profile as well and for trader it is important to keep a track of a few concepts from this technical analysis study.
In a nutshell, Reliance Industries now have major support near 2600 and as long as this level is intact any dip can be used as buying opportunity. Previous peak near 2800 is the resistance area. Simple price action using Volume profile can be a great indicator for Option Traders.
Learn to Trade Options using Technical Analysis (OTTA) using Volume profile, Open interest profile, Option Strategies, Payoff chart and much more scheduled on 10th – 11th December 2022. Early Bird Ends on 30th November. Know more here