SBIN: How patterns can help in trading combined with Channels & Ichimoku Cloud
Dec 03, 2020State Bank of India had exhibited a classic neutral triangle pattern. See below how the up move was predictable so seamlessly.
Neutral Triangle: This pattern is defined in Neo Wave Advanced Elliott wave that takes the category of a triangle but does not necessarily look like an orthodox triangle pattern. This is the triangle pattern in which wave c is the longest wave and wave a and e tends towards equality. Once the pattern is complete, it gives a highly reliable trade setup.
SBI Hourly chart: (Happened so far)
Wave analysis:
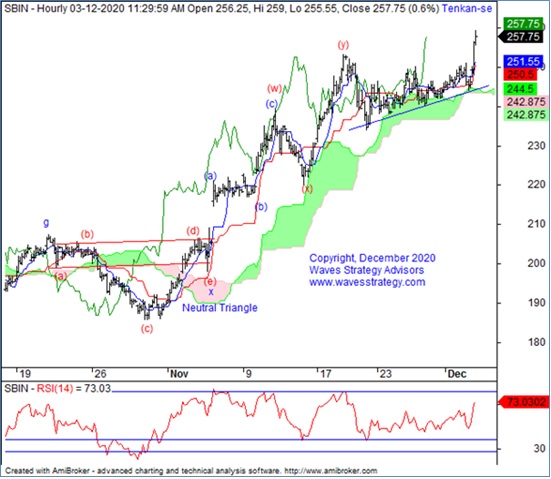
As per the wave counts, prices completed wave x at 185 levels in the form of a classic neutral triangle. Post than the second set of correction is ongoing which itself is forming a complex corrective pattern. Prices are moving in a well channelized manner and it reversed back exactly from the channel resistance and is consolidating in a range post that.
As shown on the hourly chart, prices once again took support at the Ichimoku cloud and continued to move upside. Any decisive break below the cloud will be the first indication of price reversal.
In a nutshell, SBIN might move in a range. Any break above 247 will lead prices towards 253 whereas a break below……..
Happened: SBIN is moving precisely as per wave counts and patterns. Ichimoku Cloud has been working extremely well and guided prices in up ward direction. Neo wave patterns along with correct use of Indicators like Ichimoku cloud provides an excellent trade setups. An entry at around 205 levels keeps us in the trend until now.
To know in-depth research on Nifty and 3 stocks on daily basis subscribe to “The Financial Waves Short Term Update”
Master of technical analysis (MOTA) scheduled on 19th & 20th December 2020 is going to increase your perception towards market and how it can help in deriving targets and stops loss. Enroll now in Early Bird Offer before 12th December 2020. Click Here