How to catch Momentum using Ichimoku cloud and price pattern
May 24, 2023Like this Article? Share it with your friends!
It is possible to capture good moves in stocks using price patterns along with simple indicators like ichimoku cloud. See how we identified such move in SHREDIGCEM.
Ichimoku cloud - The Ichimoku Cloud is a technical tool that indicate the support and resistance, identifies trend direction, gauges momentum and provides trading signals
The Following research is picked up from our daily Equity Research Report which our subscribers receive pre-market every day.
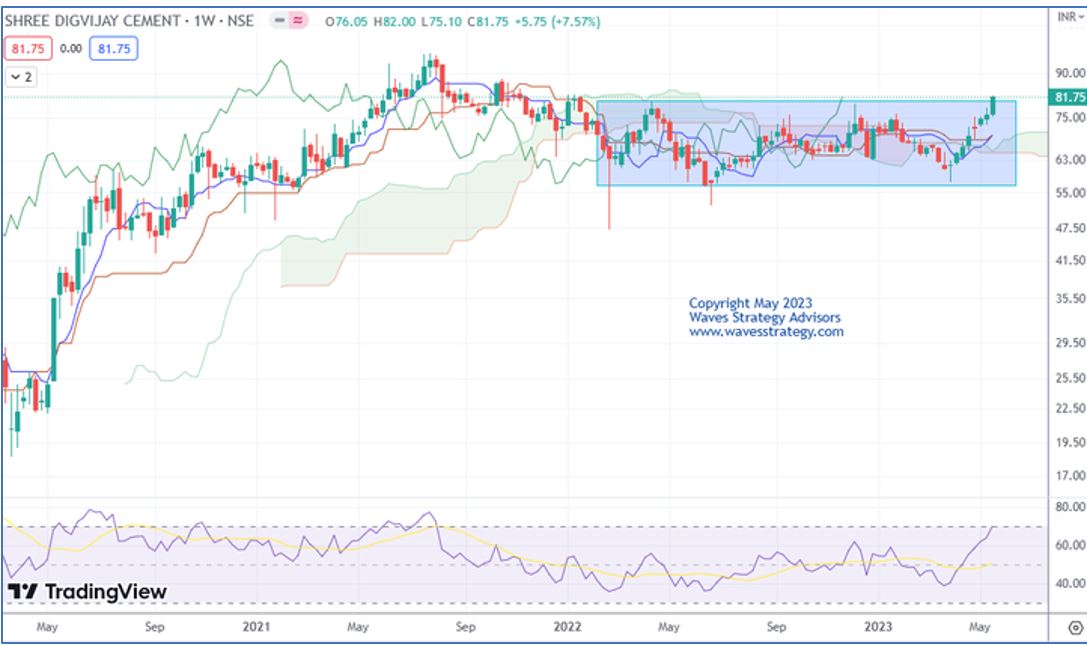
SHREDIGCEM Daily chart as on 22nd May 2023
SHREDIGCEM 60 mins chart as on 22nd May 2023

Wave analysis as published on 22nd May 2023
SHREDIGCEM has been moving higher recently and intact in strong uptrend. In the previous session it closed with a massive gain of 5.14%.
On the weekly chart, in the previous session prices formed a bullish candle. Price has been moving in a rectangular range over the last few days indicating accumulation in the stock. In the previous session prices manages to close above this trading range which has resulted in a bullish breakout of the rectangular pattern. Price is trading above the ichimoku cloud which indicate that the short-term bias is bullish.
As shown on the hourly chart, 70-day period Exponential Moving Average is acting as a brilliant support line and it has provided support at regular intervals. This suggest that one should be in the direction of the ongoing trend as far as this line is protected. Closest support is placed at 77.
In short, trend for this stock is positive. Use dips towards 80-81 as a buying opportunity for a move towards 89-90 levels as long as 77 holds on the downside.
Happened
As we expected stock after a dip witnessed a good rally of more than 5% in just 2 trading sessions. Stock made high of 86.50 and it has potential to achieved our target of 89-90 levels in coming sessions.
If we combine simple price action with price patterns then it together works like magic!!
3 Months of Mentorship on Timing the Market – Above chart simply shows how price action along with Time cycle and Neo wave can be combined. A Mentor can ensure that proper application of these methods is passed across so that it can form a powerful system to generate that parallel source of income. Be a part of Elite traders community we call as #TimeTraders. Fill below form for more details: