
Shyam Metalics 33 Period Time Cycle Nailed the Reversal Again!
Oct 15, 2026
Price tells us where the market is moving, Time Cycles help us understand when that move is likely to occur. The recent price action in Shyam Metalics & Energy Ltd is another classic example of how Time and price work together.
Shyam Metalics & Energy Ltd has once again respected its key Time Cycle window, delivering a classic reversal exactly when the cycle suggested. Let's understand what happened and what the charts indicates next.
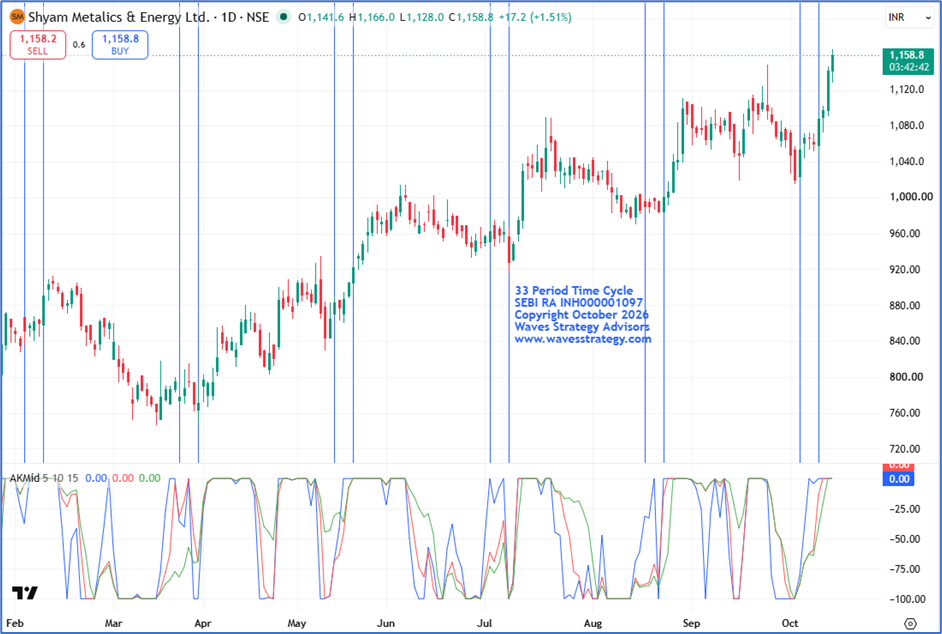
Shyam Metalics & Energy Ltd Daily chart with Time Cycle and AK Indicator
Analysis
- On the daily chart, Shyam Metalics & Energy Ltd can be observed heading higher, particularly since beginning of March 2026, in the form of Higher High and Higher Low structure indicating bullishness in the stock
- Combine this simple price action with Time cycles and one can catch lows early in the trend.
- Time cycles are fractal in nature, meaning they can be applied effectively across multiple time frames.
- In Shyam Metalics & Energy Ltd, 33-period Time cycle has been performing exceptionally well on the daily chart, consistently identifying high-probability turning points.
- The most recent cycle zone was from 6th October 2026 – 12th October 2026 where prices made a short-term low near 1015 levels and surged by nearly 15% since then.
- At the same time stock has also broken above the prior swing high near 1148 indicating that the cycle is on the buy side.
AK Indicator
- The AK Indicator is a custom-built tool used to track trend maturity, momentum and trend strength.
- On the AK Indicator, currently all three lines have started trading on 0 line, providing double confirmation. This suggests that bullish momentum is likely to continue.
Conclusion
- Time Cycle, when combined with simple price action and AK Indicator, can provide powerful trend signals.
- Entering at the right time of the breakout can help traders capture a trending move efficiently.
- As per the setup, prices have already broken above the prior swing high and upside momentum is likely to continue.
- A decisive move above 1166 can extend this rally further towards 1240 or higher.
- On the downside, 1100 remains a crucial support level to watch in the near term
Learn Advanced Technical Analysis with Brahmastra
Brahmastra — Technical Analysis Mentorship
Learn the science of trading with algo creation, stock selection, options trading, Elliott Wave and Neowave.
In the Brahmastra sessions, you will learn how these concepts can be combined to develop a structured approach to market analysis and trading. Fill below form for more details: