7% Rally Captured in Tata Communications Using Simple Price Action
May 20, 2026
When we combine Price action along with technical indicators like (EMA) Exponential Moving Average and Moving Average Convergence Divergence (MACD), it helps to form powerful setups with accuracy with simple analysis Tata Communications Ltd has moved precisely as predicted which confirms simple things work in the market.
We published the following research on Tata Communications Ltd on 15th May 2026 in the “Vayu Momentum Report” which our subscribers receive pre-market every day.
Tata Communications Ltd Daily Chart Anticipated as on 15th May 2026
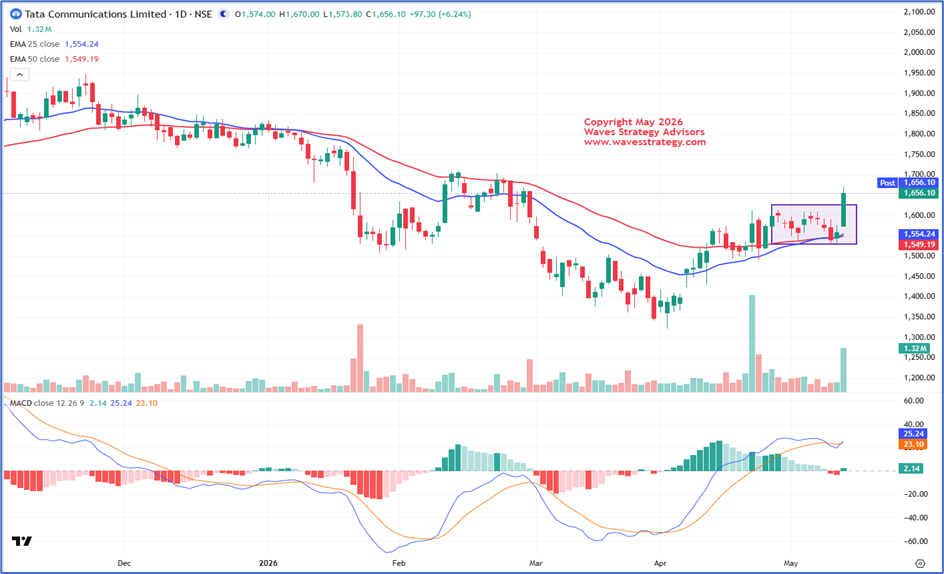
Anticipated as on 15th May 2026
On the daily chart, Tata Communication Ltd. was trading in a small range of 1530 – 1623 since 28th April 2026, indicating a phase of accumulation. In the previous session, stock surged more than 6% and finally gave breakout of the range and closed above it at 1656.1 which indicates a bullish strength in the stock. Along with the rise in price, there was also sharp rise in volume, which adds reliability to the breakout and confirms its bullish strength.
Also, 25 period EMA line (blue) crossed above the 50 period EMA line (red) on 13th May 2026, indicating a positive shift in the stock direction and increasing buying strength. If the price manages to sustain above this crossover, further upside movement can be expected in the upcoming trading sessions. Along with that, on momentum indicator MACD (Moving Average Convergence Divergence), MACD line is crossing above the signal line from downside and formation of green histogram above the zero-line suggesting strengthening bullish momentum due to which further upside move is expected in upcoming trading sessions.
In a nutshell, overall trend for Tata Communication Ltd. is on the side of bulls. For now, one should use dips as buying opportunity for a move towards 1750 or higher with support being around 1570.
Tata Communications Ltd Daily Chart Happened as on 20th May 2026
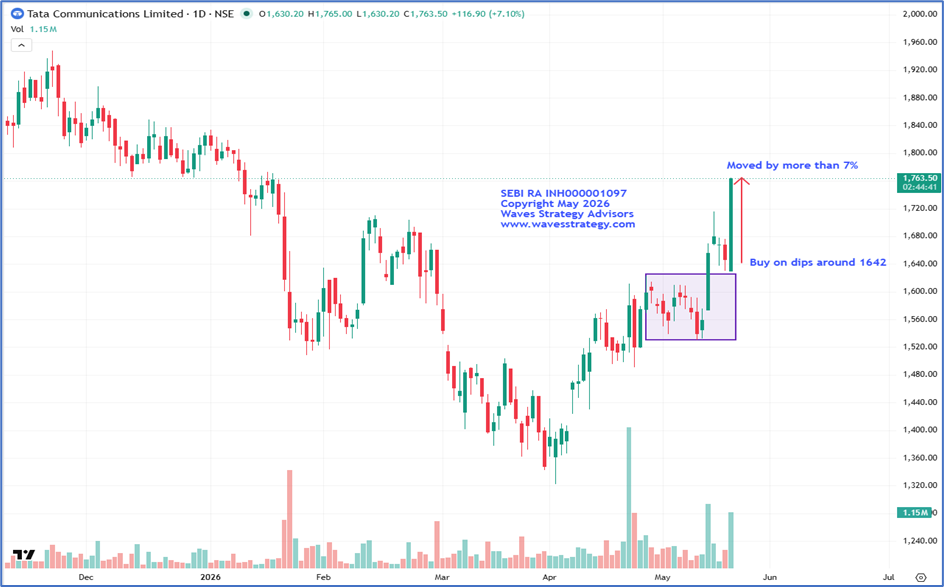
Tata Communications Ltd perfectly respected the anticipated buying zone of 1648.5–1642 on 18th May, where a long position was initiated with a stoploss placed at 1580 and a target of 1750. After witnessing a healthy dip into the suggested accumulation range, the stock showed strong bullish momentum in today’s session, surging more than 7% and BANG ON!! Target achieved and the price action continues to remain bullish.
In a nutshell, TATA Communications Ltd has given a breakout. For now, use dips as a buying opportunity which can bring out the targets of 1785 followed by 1810 levels. On the downside, 1630 levels are the nearest support to watch out for!
Our accurate stock market analysis and timely trading insights continue to identify high-potential stocks before major moves. Subscribe to the Vayu Research Report for early stock recommendations and high-probability trading opportunities.
Brahmastra (Mentorship on Timing the market)
Learn to time the market and trade with me for the period of 3 Months including Live trading, stock selection, Momentum, and Multibagger stock identification, Timing the entry to the very Day, Hour, and Minute using Time cycles and Elliott Wave analysis. Get access to Kaal Chakra (Master of Cycles) as soon as you register for Mentorship, Fill below form for more details: