Tata Motors Time Indicator as Buy / Sell Signal
Nov 09, 2022
Like this Article? Share it with your friends!
Tata Motors has continued to consolidate over past many weeks but Time is getting aligned with price now.
Below chart of Tata Motors show Time cycles around which we are seeing strong up move which is also confirmed by Indicator with parameter as per Hurst’s Time Cycles.
Tata Motors weekly chart
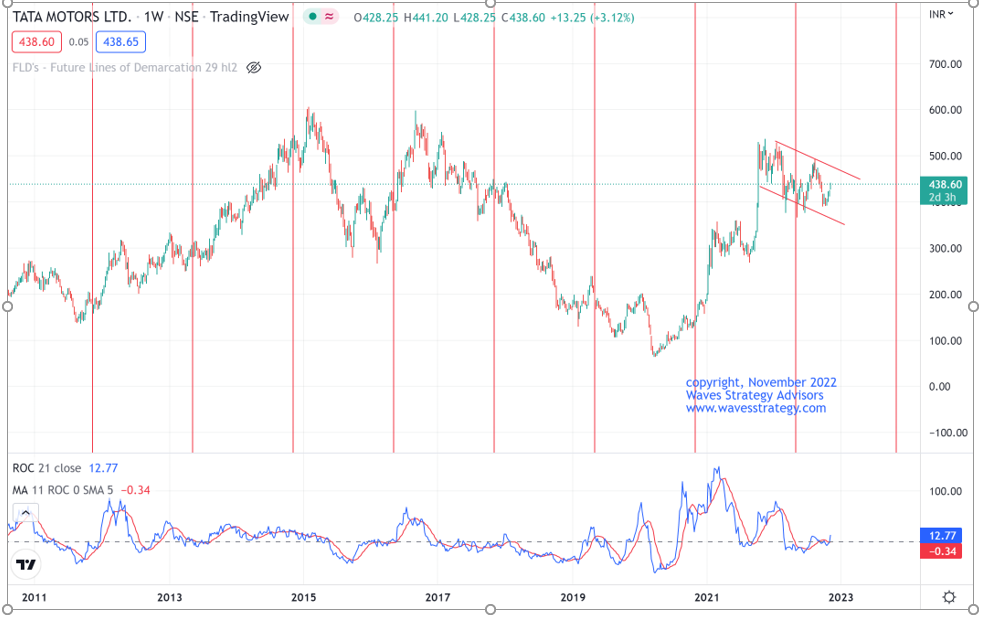
As shown above every 78 weeks Tata Motors move on upside. If the major trend is negative then only minor pullbacks are witnessed but if the overall trend is bullish we get to see strong upside thrust.
Even the recent low made near 366 on 9th May 2022 was near this cycle and prices moved sharply higher from there.
The indicator of ROC is tweaked as per Time Cycle. This is scientific approach to trading and we can see that whenever the blue line crosses above the red along with crossover above 0 there is good upward momentum. The same is also seen recently.
It is important to understand these time tools before taking any directional bet and if applied correctly can result into strong returns.
In a nutshell, time is supportive for Tata Motors as long as 365 is protected and the stock is showing accumulation signs. To Time it to the very Day or Hour one can use smaller time frame charts.
3 Months of Mentorship – Learn this science of Timing the Stocks even on 5 minutes, 15 minutes, hourly time frame or for creating Multibagger portfolio of stocks along with signaling method. Fill below form for more details on Mentorship, only a few seats left