TCS: How far will it go? Amazing trend and power of impulse!!
Jul 16, 2020The IT index has been known to move independently than the benchmark Nifty50 index. TCS has been one of the outperformers in the IT sector which continues to give great returns to its investors.
A good moving average tends to provide support on dips during rallies and resist price on pullbacks during downtrends
Below is the chart we published in our monthly report, “The Financial Waves Monthly Update”
TCS weekly chart: Anticipated in May issue Monthly report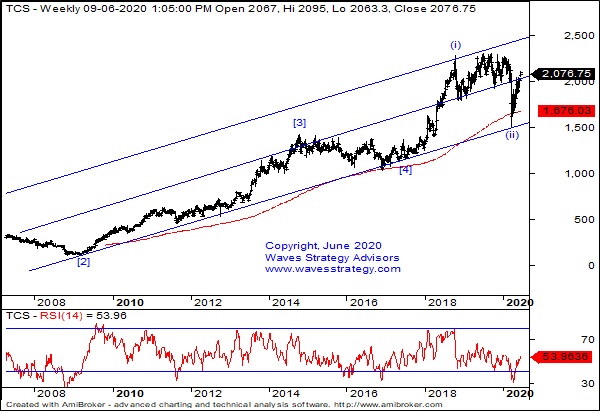
TCS weekly chart: Happened as of now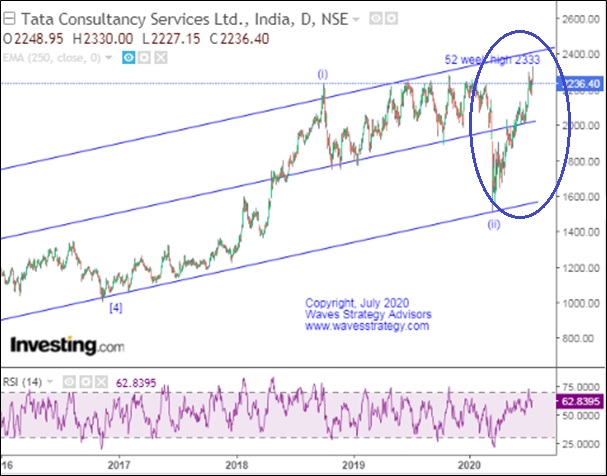
(Below is the extract of the research from our Monthly report)
Elliott Wave analysis: TCS is moving in primary degree wave [5].We can clearly see that intermediate degree wave (ii) formed a three wave correction. Wave (ii) completed near the low of 1506 levels which coincided with the [2]-[4] trend line and now we are seeing the rally in the form of wave (iii). We are not ruling out the possibility of a terminal pattern within primary wave [5] but either ways the third wave in any motive wave can never be the shortest, hence from the medium term perspective we are bullish on the stock. There is enough room within the channel for price to move towards to the upper channel line.
Moving averages: We have identified the 250 week EMA which has successfully supported rallies in the past and dips towards this average are a great buying opportunity as major lows have formed at this average. The steeper the slope of the average, the stronger is the strength of the trend and hence if we see a flat moving average, it is a period of consolidation and price can whipsaw around it. As we can see recently price dipped towards the rising 250 week EMA and bounced up from it.
In a nutshell, trend for TCS is positive and can continue to move higher towards …. levels as far as ….. level remains intact on the downside.
Happened – Post recommending the stock prices are moving in line with our expectations. On 16th July 2020 (today’s session) it made is new 52 week’s high near 2333 levels.
To view complete details get access to the monthly research report – The Financial Waves monthly update
Upcoming Become Market Wizard (BMW)Training : I will be discussing all of the above methods on how to identify patterns and combine them with important indicators and Elliott wave, Neo wave theory, indicators Only limited seats, Register now for Most advanced training on Technical analysis Ever – know more here