Tech Mahindra’s Textbook Rally: How Elliott Wave + Price Action Predicted the Move
Dec 03, 2025
When Elliott Wave analysis is combined with simple price action, it creates powerful and highly accurate trading setups. The effectiveness of this approach is clearly visible in the way Tech Mahindra Ltd has been moving exactly in line with the projected wave counts.
Similarly, we published our research on Tech Mahindra Ltd in the “Vayu Momentum Report” on 21st November 2025 — a pre-market publication delivered to all our subscribers. The stock has since performed precisely as anticipated, further reinforcing the strength of Wave Theory.
Tech Mahindra Ltd Daily Chart Anticipated as on 21st November 2025

Wave analysis anticipated as on 21st November 2025
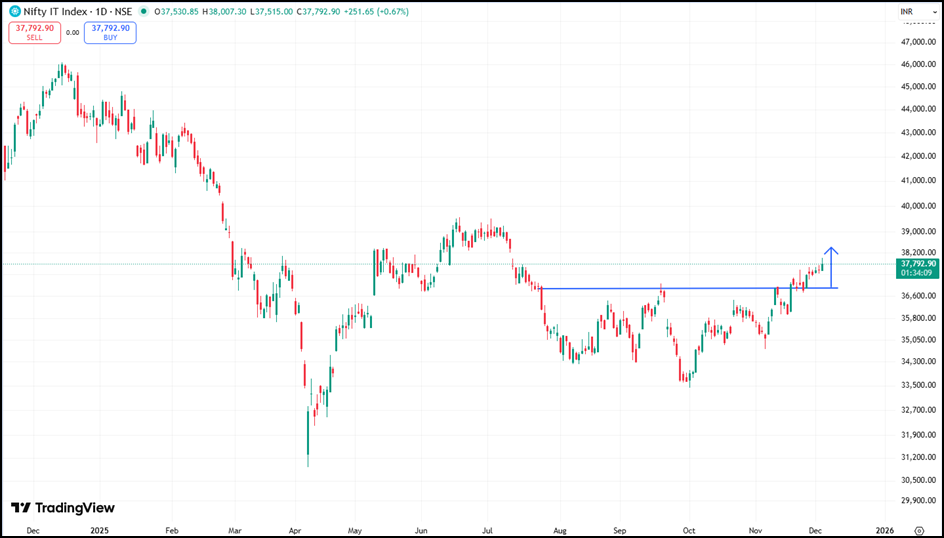
The Nifty IT Index has begun to show signs of relative outperformance over the past few sessions. Selective IT stocks have started picking up momentum, indicating the possibility of a broader sectoral revival. Within this space, Tech Mahindra stands out due to its recent price behavior and emerging bullish signals.
Since August, the stock has displayed a pattern of false breakdowns, where prices slipped below key support zones only to reverse sharply on the upside. This formation typically traps late sellers or overly bearish participants, thereby increasing the probability of a sustained reversal.
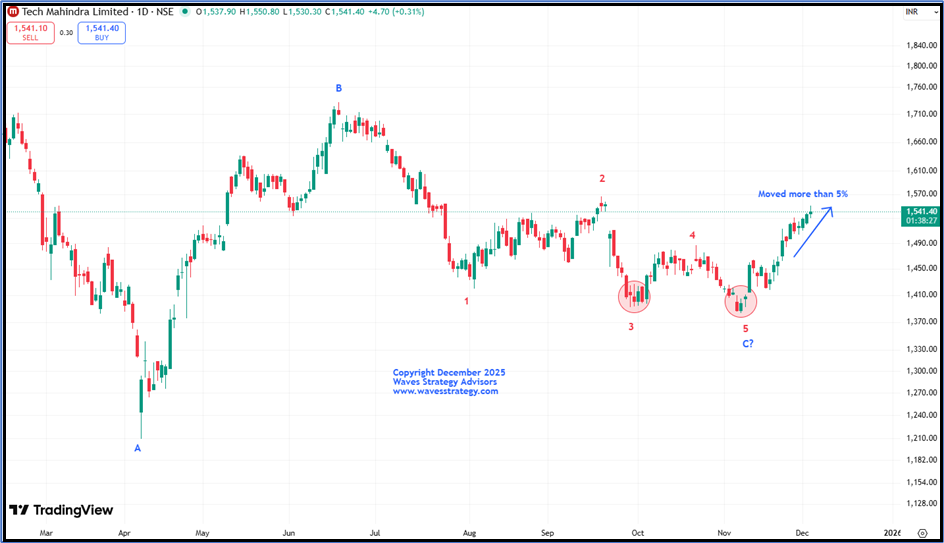
Most recently, Tech Mahindra briefly breached below the 1400 mark but once again reversed upwards, reinforcing the idea that the downside is being consistently defended by buyers. A decisive breakout above 1470 will act as a strong confirmation of trend reversal and can open the doors for meaningful upside.
On the upside, the immediate target post-breakout is placed around 1500, followed by 1540. These levels correspond to previous swing resistances and Fibonacci-based projections. On the downside, the stock holds strong support near 1429. As long as this support zone remains intact, the bias stays firmly positive.
From an Elliott Wave perspective, the entire decline appears to be a Wave C formation, which itself has unfolded into an Ending Diagonal pattern—a classic reversal formation. Within Wave C, Wave 5 seems to have completed near the lows of 1380, indicating that the corrective phase may be over. Prices typically retrace toward the start of the wedge/diagonal, and while that projection lies higher, a conservative upside target of 1550 is being considered at this stage.
In a nutshell, the technical structure for Tech Mahindra has turned constructive. The stock is showing signs of a potential trend reversal, supported by both price action and Elliott Wave analysis. Fresh long positions can be initiated above 1470, with targets of 1500, 1540, and a broader conservative target of 1550, while maintaining support at 1429.
Tech Mahindra Ltd Hourly Chart Happened as on 03rd December 2025
IT Sector daily chart as on 03rd December 2025
Happened as on 03rd December 2025
The IT sector finally delivered a strong breakout in the previous week, just as highlighted in our recent research reports. Among the IT stocks, we selected TECHM with an expectation of an upside reversal and it played out perfectly. We expect wave C to get complete in form of ending diagonal pattern and post which upside reversal was expected. After crossing above 1470 levels, stock rallied more than 5%, hitting both our projected targets and marking a high of 1550.80 in today’s session. TECHM not only achieved our given targets in the Cash segment but also in the futures and Options segment as well. This is the magic of Wave Theory!
It is truly remarkable how combining Wave Theory with simple price action can consistently help forecast price targets with such high accuracy.
In a nutshell, one can continue to use dips as a buying opportunity in Tech Mahindra Ltd for an upside move towards 1600 levels as long as we do not see a reversal as per 3 candlestick rules.
Want to know more about such stocks like Tech Mahindra Ltd. Subscribe to our Vayu Short-Term Update: Get a list of stocks with high growth potential: Check Here
🔥 Mentorship Program – Brahmastra (Timing the Markets)
Take your trading mastery to the next level with Brahmastra Mentorship, where you will learn:
- Elliott Wave & NeoWave trading
- Complete Options Trading System
- Time Cycles
- Stock Selection Algorithms
- Practical Market Execution
📌 Click here for more details and enrollment.
📌 Learn Elliott Wave, NeoWave, Fibonacci & Timing the Market
🚀 Sutra of Waves workshop is happening on 6th & 7th December
Join this powerful 2-day learning experience covering:
- Advanced Elliott Wave
- NeoWave
- Ichimoku Cloud
- Fibonacci Techniques
- Two-Stage Confirmation System
⏳ Limited Seats Only — Register Now
👉 Fill the form below to secure your seat.