TIINIDIA - How to trade using time cycle?
Sep 27, 2021
Like this Article? Share it with your friends!
Precise entry points can be best found using time cycles in confluence with other technical indicators. Checkout the research below which shows where the next best buying opportunity lies in TIINDIA.
TIINDIA Daily chart :
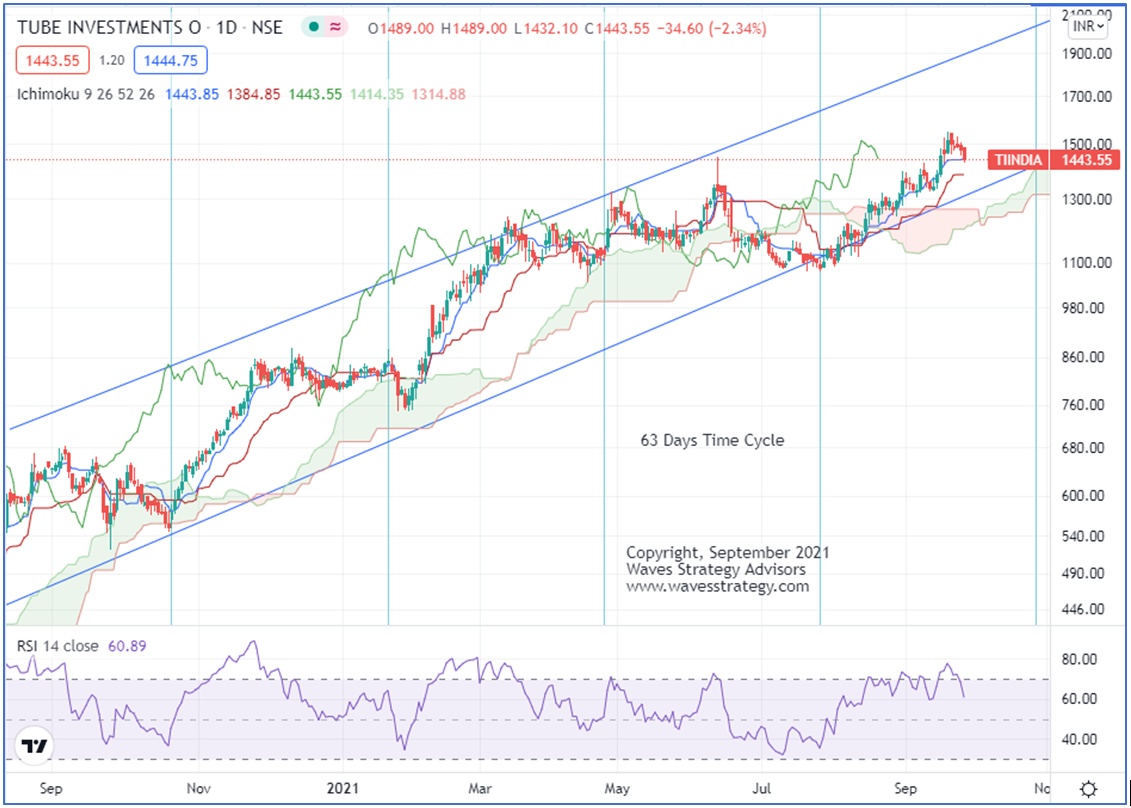
The vertical lines on the above daily chart are at an interval of 63 days each. This is the 63-day time cycle that is plotted on TIINDIA. Notice how every time price approaches the day of the time cycle an important swing low is formed with a slight margin of 2-3 days. Hence, we can use this time cycle to time our entry in this stock.
We can see that prices are now midway from the next cycle occurrence which is on 27th October hence we expect prices to dip lower within the next 20 days. The trajectory of this stock has been along the rising channel and the next time prices approach the support level of the channel and the Ichimoku cloud around 27th October, one can look for a buying opportunity based on candle reversal patterns at the confluence of these 3 indicators.
This is a simple way by which one can combine Time Cycles along with Candlestick patterns and other technical indicators to identify a high accuracy trade setup.
Master of Cycles Simple strategies like these are very effective in systematic trading. One can learn the right way to plot time cycles in our upcoming Master of Cycles program on 9-10th October 2021, Limited seats only. Click here to know more details.
Mentorship on Timing the Markets for the FIRST TIME EVER starts November 2021 – In this Mentorship program, all the necessary tools are given right from stock selection methods, strategy, follow-up action to derive a complete trade setup in step by step fashion. To know more fill the form below: