Time Cycles and Neo Wave Nailed Nifty’s 1800-Point Move
Apr 08, 2026
Neo Wave analysis, when combined with Time Cycle studies, helps create high-probability trade setups with greater accuracy by aligning price structure with timing, allowing traders to identify stronger entries, better risk control, and more reliable market reversals.
Using the power of Time cycle and Neo wave, we successfully anticipated Nifty’s upcoming move in our Aakash Monthly Report published on 27th March 2026. Check it out!
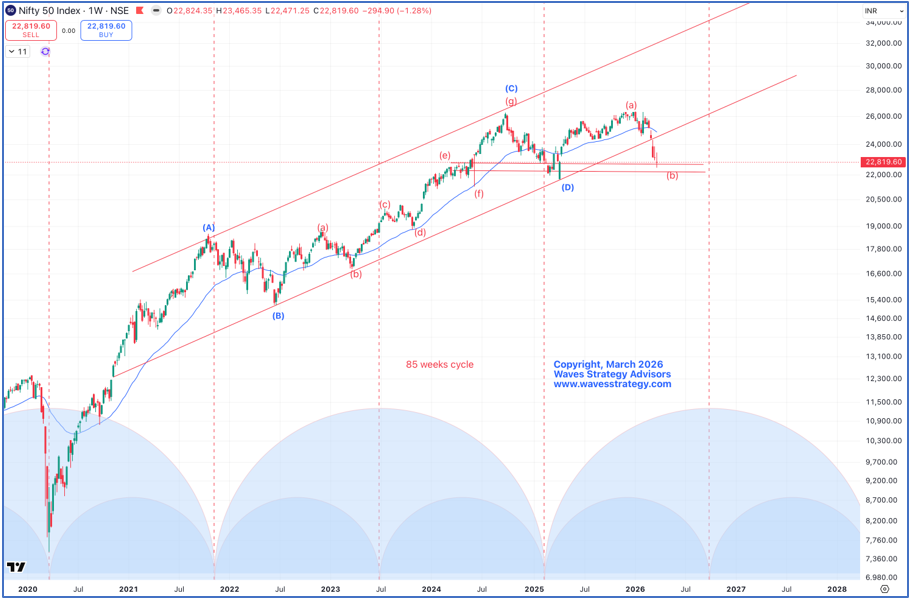
Nifty Weekly chart anticipated as on 27th March 2026
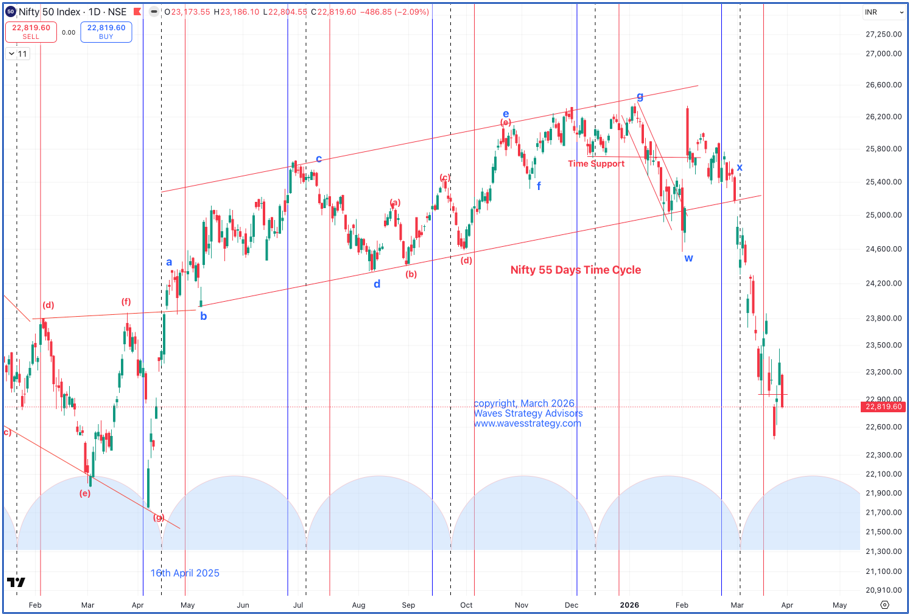
Nifty Daily chart anticipated as on 27th March 2026
Anticipated Analysis as on 27th March 2026
Nifty has witnessed heightened volatility throughout the month of March, primarily triggered by geopolitical tensions following the US–Israel attacks on Iran. This instability has led to erratic price behaviour, and importantly, prices have broken below key support levels during the month. The monthly chart has formed a large bearish candle, indicating strong distribution pressure and a weakening overall structure.
Despite this weakness, our wave structure remains unchanged for now. We continue to interpret that Wave E has been in progress since April 2025, and the current decline is unfolding as Wave B of the larger degree Wave E. As per this view, the ongoing correction is expected to complete above 21,760, which is the low formed in April 2025. This level becomes critical for the validity of the current wave structure, and any sustained move below 21760 will force a reassessment of the wave count
In terms of price behaviour, the market continues to show short term weakness, with no weekly close above the prior week’s high for the past seven weeks.
But any announcement of cease fire can result into a major Gap up opening to the extent of 700 – 1000 points. However, price action post this event when it happens will be crucial.
From a level-based perspective, 23500 acts as an important short-term trigger on the upside, and only a decisive move above this level will be the first indication of a potential reversal. On the downside, 22200 serves as immediate support, followed by the critical zone of 21760–21743, which will act as a trend-defining region in the coming weeks
Overall, the market is currently in a fragile state. While the existing wave structure still allows for the possibility of a meaningful low formation, this view remains strictly conditional on key supports holding. Until 23500 is reclaimed decisively, the broader stance should remain cautious and defensive.
Nifty Daily Chart Happened as on as on 08th April 2026
In our monthly report, we had highlighted the strong possibility of an immediate short-term bottom forming near the 22200 level. We also emphasized that a decisive close above 23500 would act as a trigger for an upside reversal—a scenario that has unfolded exactly as anticipated.
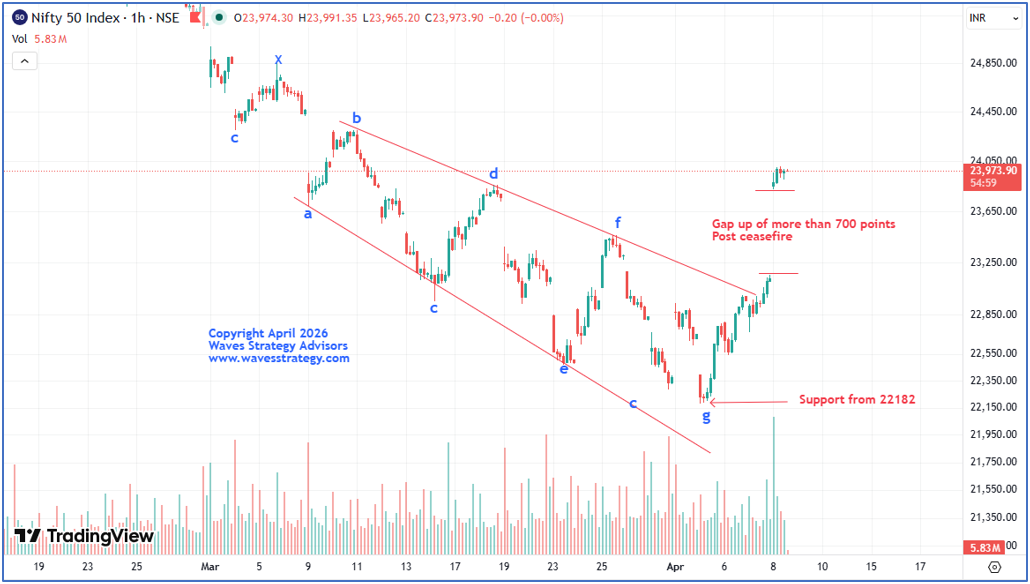
Initially, Nifty remained under pressure, eventually marking a low around 22182. From there, the index staged a sharp recovery, rallying nearly 950 points. The momentum intensified further in today’s session, where the market witnessed a massive gap-up opening of over 700 points, driven by positive global cues following the US–Israel–Iran ceasefire development.
Bang on! The index delivered a total move exceeding 1800 points, aligning precisely with our projected outlook.
This move was not incidental—it was well anticipated in advance using the combined strength of Time Cycle Analysis and Wave Theory. Once again, this reinforces the effectiveness of our framework in identifying major turning points and capturing high-probability market opportunities with precision.
In a nutshell, Nifty has been bullish much before the cease fire announcement and we have alerted it here in our short-term research report- Agni to avoid selling. Neo wave pattern has worked out extremely well & we can expect a move to 24300 levels with dips to 23580 – 23640 as buying opportunity to enter the trend as long as 23440 is intact.
Brahmastra (Mentorship on Timing the market)
Learn to time the market to the very Day, Hour and Minute by combining the concepts of Hurst’s Time cycle on Index and stocks as well, Gann square of 9, Elliott wave, Neo wave and be a part of elite trader’s community who are Time Traders.
Fill the form now
3 Months of TRISHUL Membership (Options Mantra+ Elliott Wave+ Neo Wave)
Trishul Membership – Options Trading with Elliott wave, Neo wave, Ichimoku cloud, and sacred science of trading & forecasting is covered in the Options Mantra Live Sessions - 11th - 12th April & Sutra of Waves Live Session - 9th - 10th May 2026. Limited seats available.