Titan: 3 trend following indicators & 1 channel technique, Combination of 4 is amazing
Sep 03, 2020Titan was in the top gainers list with 5% gains in today’s trading session. Learn how to understand certain indicators which would help you to build confidence on up move.
#3 indicators and #1 basic technique applied on a plain chart to understand why there was a rise and is this rise sustainable.
See below the chart and research what made us to gauge the more than 5% up move on daily basis.
Titan hourly chart:
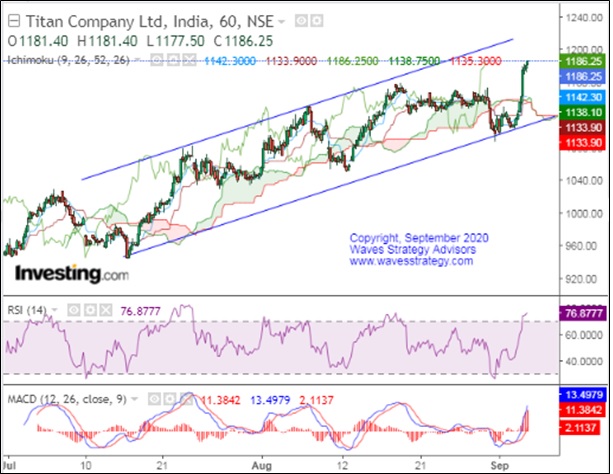
Chart Analysis:
We have shown hourly chart of Titan, 3 indicators/ techniques mentioned below are just for learning and understanding purpose kindly make full use of it by knowing how to use these studies altogether to understand the overall trend.
Channels: The simplest of all techniques which connect all the support and resistance levels and help us in gauging the stocks trend which could be up, down or sideways. In above chart you can see upward slopping blue channel from where prices have exactly bounced off from the channel support. Also you can see space in the channel which can allow prices to move more higher towards channel resistance.
RSI: The Relative Strength Index (RSI) is a momentum oscillator that measures the speed and change of price movements. Many people use RSI to understand overbought and oversold state of market but during strong trending moves prices can remain in strong overbought region or oversold region for extended period of time. It therefore becomes necessary to see if market is in a trending mode or a trading range. Here in above chart the RSI is approaching towards overbought region so some consolidation cannot be overruled to sustain higher.
MACD: The MACD indicator is a momentum indicator based on the difference of the 12 and 26 EMA. The MACD line crossing above the signal line indicates rising momentum. We can see on the hourly chart MACD is about to cross the signal line on the upside and both are already above the zero line. The MACD has now confirmed that bullish momentum is just about to ignite.
Ichimoku Cloud: Ichimoku cloud is a classical indicator within technical analysis that incorporates multiple methods and forms a very strong basis to identify the trend, momentum, reversals and much more. In the above hourly chart as prices moved above the cloud there was an indication that the next wave on upside has started.
Get access to stock tips, Nifty and Bank Nifty calls along with daily research report to ride the on-going trend in the market. Such trending moves on stocks or index is not very often. Get Access here
November 2020 Mentorship: I will be covering various such indicators and strategies which can be applied across all asset classes. It can be attended by any type of trader right from Beginner to Expert trader as the methods will be different then you might already know with complete objectivity and deriving important dates, Register Now here or Contact / WhatsApp on +91 9920422202