
Titan: OI, Keltner & KST Reveal What Comes Next?
Aug 10, 2026
Keltner Channel and KST when combined can be a powerful setup, one can use it directly to trade options.
This setup helps traders to catch the momentum early which can be useful especially when buying options so that one can stay ahead of the majority crowd.
TITAN Hourly chart with Open Interest, KST indicator & Keltner Channel
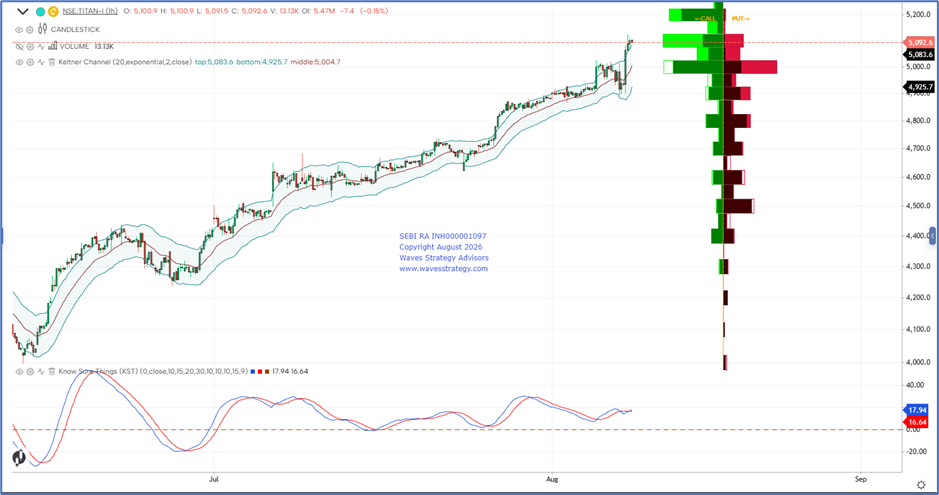
Open Interest
-
Open Interest represents the total number of outstanding contracts in a specific instrument at a given time.
-
OI analysis can be used for both positional and intraday trading.
-
It is generally viewed from the seller’s perspective as it helps identify the activity of big market participants.
Understanding the OI Chart Structure
-
The left-side represents Call Open Interest.
-
The right-side data represents Put Open Interest.
-
These OI levels help traders identify important resistance and support zones in the stock.
Understanding KST indicator
-
The KST (Know Sure Thing) indicator is a momentum-based indicator.
-
It helps traders assess the overall strength and direction of price movement.
Combining Keltner Channel with KST Indicator
-
Keltner Channel shows if there is a significant movement and breakout in one direction.
-
Just a breakout on Keltner Channel is not sufficient as it has to be looked in accordance to the momentum indicator which is a KST crossover.
Trading Strategy
-
On the hourly chart, in today’s trading session, stock gave a breakout of the Keltner channel.
-
This was followed with KST indicator giving a crossover [KST line (Green) crossing above Signal line (Red)].
-
Both lines are already trading above the zero line which indicates momentum is developing.
-
But to create long position prices should cross above the breakout candle of Keltner channel which can generate a buy signal.
-
As per OI data, a decisive move above 5100 may trigger Call short covering, potentially pushing prices higher to 5350- 5400, while 5000 remains an important near-term support.
Conclusion
-
Open Interest analysis simplifies options trading by highlighting the positions of big players. Traders can trade accordingly by combining KST indicator and Keltner Channel.
-
A decisive move above 5125 can push prices higher towards 5400, while 5000 can act as a strong support level.
Brahmastra (Mentorship on Timing the market)
Learn to time the market to the very Day, Hour and Minute by combining the concepts of Hurst’s Time cycle on Index and stocks as well, Gann square of 9, Elliott wave, Neo wave and be a part of elite trader’s community who are Time Traders.
Fill the form now
3 Months of TRISHUL Membership (Options Mantra + Elliott Wave + Neo Wave)
Trishul Membership – Options Trading with Elliott wave, Neo wave, Ichimoku cloud, and sacred science of trading & forecasting is covered in the Options Mantra Live Sessions - 29th - 30th August & Sutra of Waves Live Session - 10th - 11th October 2026. Limited seats available.