Ujjivan: Adhering with Fibonacci Retracement levels, Channels, EMA
Jul 09, 2020Ujjivan seamlessly moved higher post bouncing off from the channel support and retraced up to 50%.
Channels are the most basic and effective technique which helps in finding important support and resistance zones. As per our analysis majority of the time channels work extremely well and helps in finding the exact reversal areas.
Fibonacci ratios when applied along with Elliott wave give a very powerful method of forecasting. We have applied this method on Ujjivan and it worked out brilliantly well!
Look at the below chart of Ujjivan published in the equity research report on 03rd July 2020 morning before markets opened – “The Financial Waves short term update”
Ujjivan 60 mins chart (Anticipated as on 03rd July 2020)
Ujjivan 60 mins chart (Happened on 9th July 2020)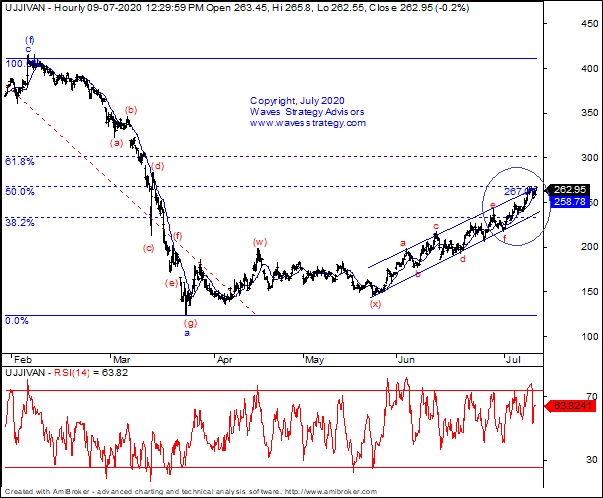
Wave analysis:
On daily chart, we can see prices are sustaining above the blue channel resistance. Currently the entire stock is moving in the form of Diametric pattern wherein corrective wave (g) seems to be ongoing within which wave b is unfolding in the form of complex correction. Break above prior day high on closing basis can take prices even higher and might retrace up to 50% of entire down fall.
On hourly chart, within wave (g) we seem to be moving in complex correction in the form of wave (y) (red) seems to moving in overlapping manner which is suggesting the diametric pattern formation wherein wave g is coming on upside. Prices are moving in well channelized manner as long as the 20 hours moving average is intact, the up move might continue and we can expect the move towards upper trendline of the channel.
In short, the trend for Ujjivan seems to be positive. Move towards 250 or higher can be seen as long as 228 the hourly moving average remains intact on downside.
Happened: Ujjivan precisely moved as expected and as per direction of wave counts which pointed on upside in the form of wave g. It was also adhered to Fibonacci levels and retraced up to 50% of fall.
We cannot be more accurate than this. The above research shows how well Elliott waves work and how different tools could help in deriving the exact entry points and targets for the same. Get access to the daily equity research report & capture good trading opportunity over short term “The Financial Waves short term update”- Get access here
Register for our Intraday/positional Nifty, Bank Nifty and Equity, Commodity, Currency calls service and trade precisely. Register here
Get strategies which could be applied across all segments in the upcoming ONLINE training scheduled on 25th &26th July in Master of Technical analysis (MOTA). Also learn about Neo wave, Elliott wave, Time cycles scheduled on 22nd and 23rd August (MOW). You do not necessarily require prior knowledge of technical analysis and we will ensure you get it right from the very basic to most advanced level. Dedicated discussion groups will be created to keep the learning going in future. Register now under Early bird offer which ends on 12th July 2020 Know more here