Wave theory analysis of Pfizer before quarterly earnings
May 25, 2021
PFIZER LTD
CURRENT MARKET PRICE: INR 5300/SHARE ON 25TH May 2021
SECTOR: HEALTH
INDUSTRY: PHARMACEUTICALS
Pfizer engages in the business of manufacturing, marketing, trading, import and export of pharmaceutical products. The company is expected to announce its quarter earning ending March 2021, on 26th May 2021, let us have a wave theory snapshot of the company before expected earnings.
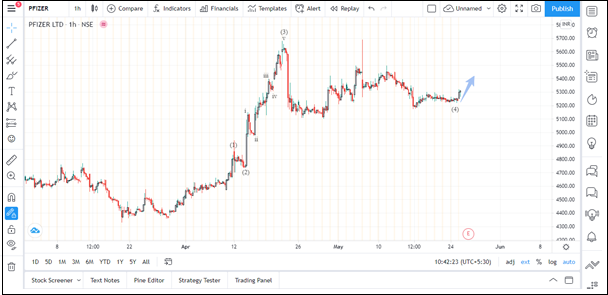
PFIZER HOURLY CHART: WITH ELLIOTT WAVE COUNT
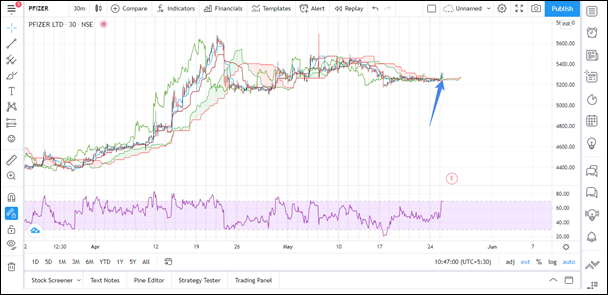
PFIZER HALF HOURLY CHART: WITH ICHIMOKU CLOUD
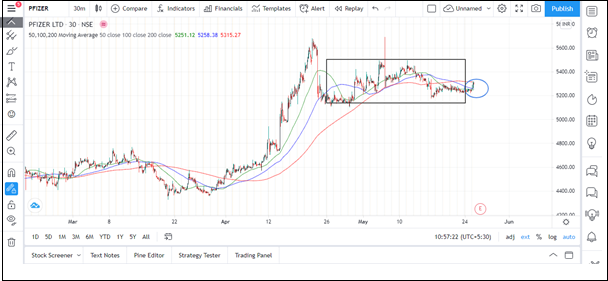
PFIZER HALF HOURLY CHART: WITH 50-100-200 SIMPLE MOVING AVERAGES
Elliot Wave Projection and Analysis:
As we can see above, on the hourly chart, Pfizer Limited has seen to complete wave 4 at 5200 levels, and about to begin wave 5 at these levels, as marked on the chart.
On half hourly time frame, we can see with the help of indicators like Ichimoku cloud and Relative Strength Index(RSI) that, prices are piercing from below to cross the upper band of Ichimoku cloud which also confirms that Prices are gaining strength at 5250 levels. Standard RSI reading on daily chart stood at 70 also confirms the positive bias in the stock with short term bullish confirmation.
In short, A break above 5200 levels could take the price towards 5600 levels till 5100 levels are maintained on the downside.
Get access to “The Financial Waves Equity research report” that contains detailed outlook on Nifty and stocks using these Simple concepts of Time Cycles and Elliott Wave. Subscribe annually and get monthly research free along with it. Get access here NOW.
Master of Cycles – Learn the science of Timing the market to the very Day and Minute in easy steps and Simple fashion. No prior knowledge required. Early Bird for this two days of Event ends on 30th May 2021, Limited Seats only. Register Now and increase the accuracy drastically by timing the markets. Know more here.