What is FLAT Elliott wave correction? Applied on Copper
Oct 05, 2020Elliott wave has impulsive and corrective patterns. Identifying impulsive pattern is easier and should not take more than 10 seconds to point out on a chart.
It is during corrective phases that Elliottician start differing on patterns and predictability reduces.
In Impulsive pattern there are very less variations and so probability of knowing path ahead is higher. Accordingly one can take more risk since the pattern formation is clear.
On contrary, there is variety of Corrective patterns to name a few: Zigzag, Flat, Triangle, Complex correction. Within Flat pattern as well there are 3 to 4 different variations depending on the size of wave B. It is during such period that it becomes difficult to judge the probable termination points.
Below is one of the examples of a probable FLAT corrective pattern going on Copper.
MCX Copper hourly chart: (Anticipated)

MCX Copper hourly chart: (Happened as of now)
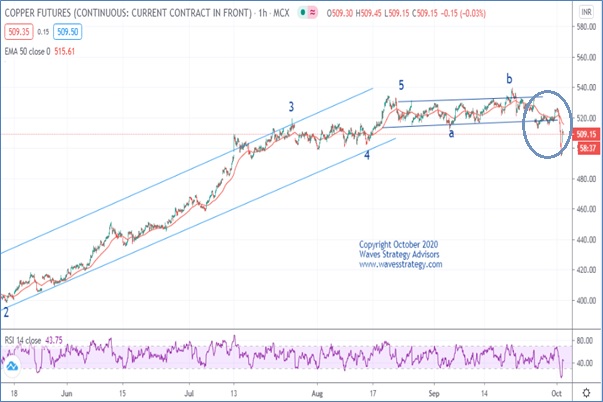
Copper has been moving in a broad range of 520-532 levels over the last few weeks with contraction in volatility. We can soon expect a breakout of this range.
On daily time frame, we are seeing the impulsive rise in wave 5 the last leg in the impulse pattern looks complete and we have started the correction probably in the form of a Flat correction.
On the hourly chart wave c of Flat seems to be ongoing. If price manages to break below 520 further down move can be seen towards 500 levels which is previous wave 4 support area. Prices have consolidating within the rectangular channel and during sideways action it best to trade Bollinger band ends. For now upper and lower band is acting as broader range.
In a nutshell, MCX Copper can continue to in range bound between 532 – 520 levels over the short term if price breaks below 520 deeper retracement of the entire up move can start with first target as 500 on downside.
Happened: You can see how patterns help in capitalizing the moves. We had figured out the down move as wave c of flat correction had begun and prices went even lower as fore mentioned levels and made low near 494 levels.
“The Commodity Waves STU” includes research on MCX Gold, MCX Silver, Copper and Crude with important levels which can help you to make your own trading
strategies. For more information Contact Us
You can subscribe to the Intraday / Positional calls on commodity via SMS, WhatsApp and get detailed research along with it explaining the clear technical picture. Subscribe Here
Mentorship November 2020: I will be covering various such patterns indicators and strategies which can be applied across all asset classes. It can be attended by any type of trader right from Beginner to Expert trader as the methods will be different then you might already know with complete objectivity. Register now here -Early Bird offer ends on 25th October 2020