ZEEL: How to trade Neo Wave Diametric Patten with Channels, Ichimoku Cloud
Jul 27, 2020Neo wave is advanced concept of Elliott wave and the key to trade profitably is identifying the pattern. Now see the Diametric pattern as per Neo wave in Crude.
Also see how well simple channeling technique works to identify the price action.
The diametric pattern is a very common pattern that we observe more often on the charts. A Diametric is a seven-legged corrective pattern and is labeled as A-B-C-D-E-F-G. Important characteristic is that wave E tends towards equality with wave C in terms of price and/or time, wave F tends towards equality with wave B and wave G tends towards equality with wave A.
Below is the chart showing detail analysis using wave patterns, Ichimoku cloud and channels.
ZEEL 60 mins chart: (Anticipated as on 21ST July 2020)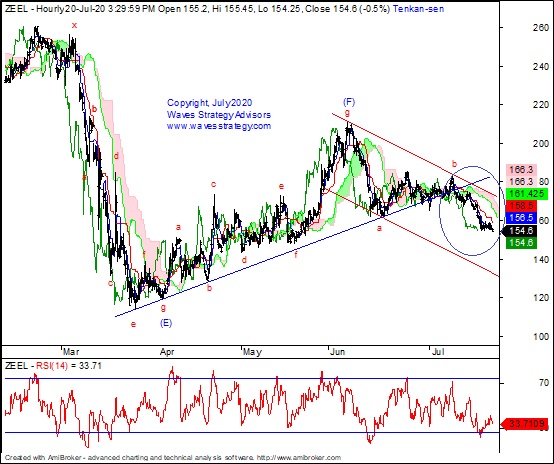
ZEEL 60 mins chart: (Happened as on 27th July 2020)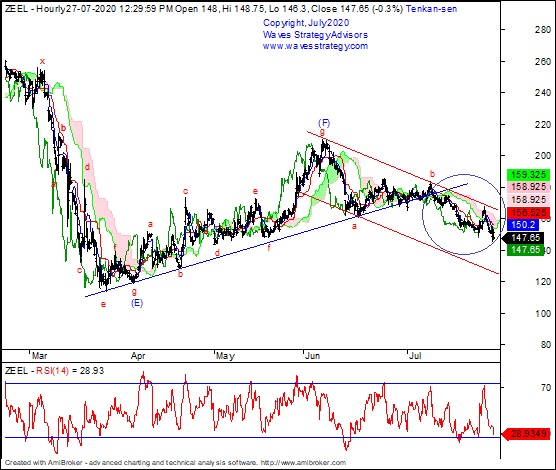
(The following is the research taken from equity report published in the morning of 21st of July, 2020 in the morning before markets starts)
Wave analysis:
On the daily chart, wave (F) terminated near 208 levels (near the upper band post which prices have reversed on downside) which were in the form of Diametric pattern. Currently wave (G) has started unfolding on downside. ……
On the hourly chart, currently corrective wave (G) is under formation within which wave c (red) unfolding on downside. Post breaking below blue trendline prices has been drifting lower. Currently as per Ichimoku cloud also prices are placed below the cloud and base conversion above the prices which indicates bearishness in the stock.
In short, ZEEL seems to be negative. Down move can be continued towards 148-145 levels as long as we do not see any retesting of hourly Ichimoku cloud near 160 levels.
Happened: Prices have moved in line with our Elliott wave pattern expectation. In today’s session it made an intraday low of 145 levels in the beginning of the session proving our weeks ago analysis in a right path.
The above analysis clearly shows how well these techniques work. Subscribe now to our “The Financial Waves Short Term Update” and know the key pivot levels which can help you take short term trade.
Learn the power of Elliott –Neo wave with advance indicators and equip yourself with tools of technical analysis in the upcoming Online module of Neo wave with Time cycles (MOW). I will ensure you stop following the news and start trading the charts because this is what is required to be successful. Know more here