
ZYDUSLIFE’s Textbook Rally: How Elliott Wave + Price Action Predicted the Move
Jul 07, 2026
When Elliott Wave analysis is combined with simple price action, it creates powerful and highly accurate trading setups. The effectiveness of this approach is clearly visible in the way ZYDUSLIFE has been moving exactly in line with the projected wave counts.
Similarly, we published our research on Zydus Lifesciences Ltd in the “Vayu Momentum Report” on 06th July 2026 — a pre-market publication delivered to all our subscribers. The stock has since performed precisely as anticipated, further reinforcing the strength of Wave Theory.
Zydus Lifesciences Ltd Daily Chart Anticipated as on 06th July 2026
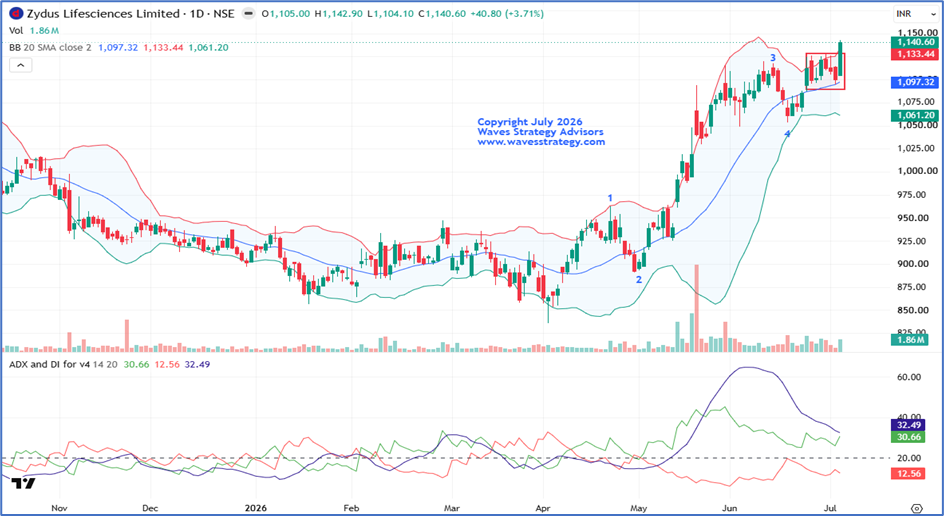
Wave analysis anticipated as on 06th July 2026
Zydus Lifesciences Ltd. has outperformed the Nifty Pharma Index, gaining nearly 4% in the previous session, while the index gained nearly 2%. This relative strength indicates that the stock is outperforming its sector indicating strong buying interest.
On the daily chart, stock was trading in a broad consolidation range of 1095 – 1129 since 23rd June 2026, indicating a phase of accumulation. In the previous session, stock gave breakout above the 1129 level and managed to give a close above it at 1140.6 levels which is a positive sign. Also, with the rise in price, there was also sharp rise in volumes, which adds reliability to the breakout and confirms its bullish strength. Along with that, since past 3 months prices are forming higher highs higher lows structure which is considered as positive price structure and indicates stock is in uptrend.
On Bollinger Bands® indicator we can observe that prices broke above the upper Bands which indicates increase in volatility which is considered as bullish sign. Also, ADX indicator is currently near 32, well above the key level of 25, indicating that trend strength is improving.
As per wave perspective, post completing wave 4 on the downside back in June 2026 stock is now moving up in the form of wave 5.
In a nutshell, the overall trend for Zydus Lifesciences Ltd. is on the side of bulls. For now, a break above 1143 can push the price higher towards 1190 followed by 1240 with 1095 acting as the strong support level.
Trading strategy for Futures - Long positions can be initiated once the stock futures break above 1148 with stoploss as 1126 and target of 1190 (One can book part tp near 1165 – 1170 and trail sl to cost).
Zydus Lifesciences Ltd Daily Chart Happened as on 07th July 2026
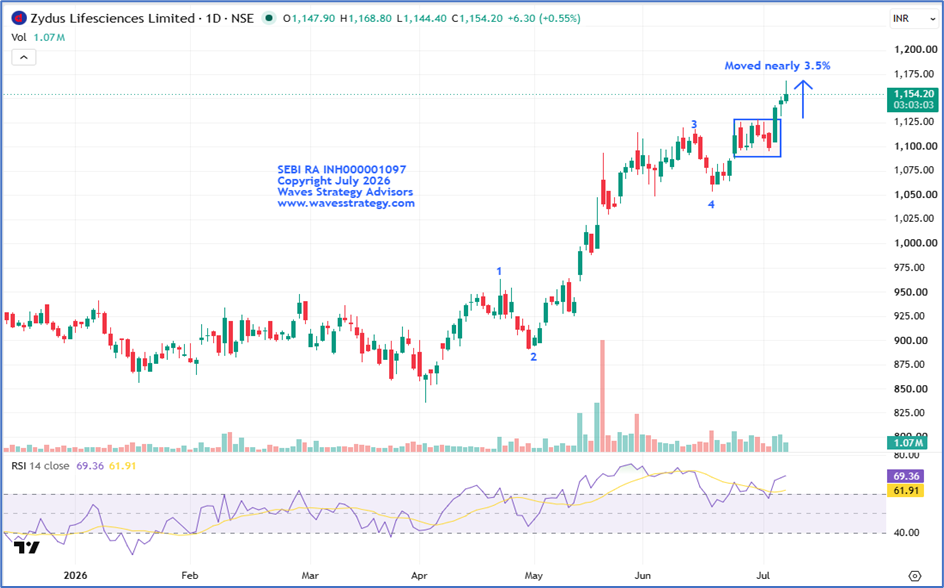
Happened as on 07th July 2026
- Post breaking out of the zone the stock moved as anticipated and achieved our part tp level of 1170 within just two trading sessions.
- The stock is still trading within the wave 5 pattern and continues to head higher with each passing session.
- It is truly remarkable how combining Wave Theory with simple price action can consistently help forecast price targets with such high accuracy.
Overall outlook going forward, Traders can create positions accordingly once it breaks above the 1170 level with key support being around 1120.
Learn Time Cycle Trading Through Brahmastra Mentorship
The Brahmastra Mentorship Program is designed for serious traders and investors who want to learn professional market trading techniques.
The program covers:
- Time Cycle Trading
- Elliott Wave & NeoWave Analysis
- Stock Selection Frameworks
- Algo-Based Market Strategies
- Risk Management and Trading Psychology
Limited seats are available.
Fill out the form below to learn more and become part of this transformational trading journey.