ARMANFIN : 2 Best Indicators You Cannot Miss!
Apr 25, 2022
Like this Article? Share it with your friends!
It is possible to capture massive moves in stocks using price patterns along with simple indicators like the ADX (Average Directional Index).
We used these 2 indicators on ARMANFIN and were able to capture a 14.86% move in a short span. You can also use these to identify stocks with momentum for short-term trades.
We published ARMANFIN analysis in "The Financial Waves Short Term Update" on 11th April 2022 which our subscribers receive pre-market every day. Check out below the detailed research report that we published.
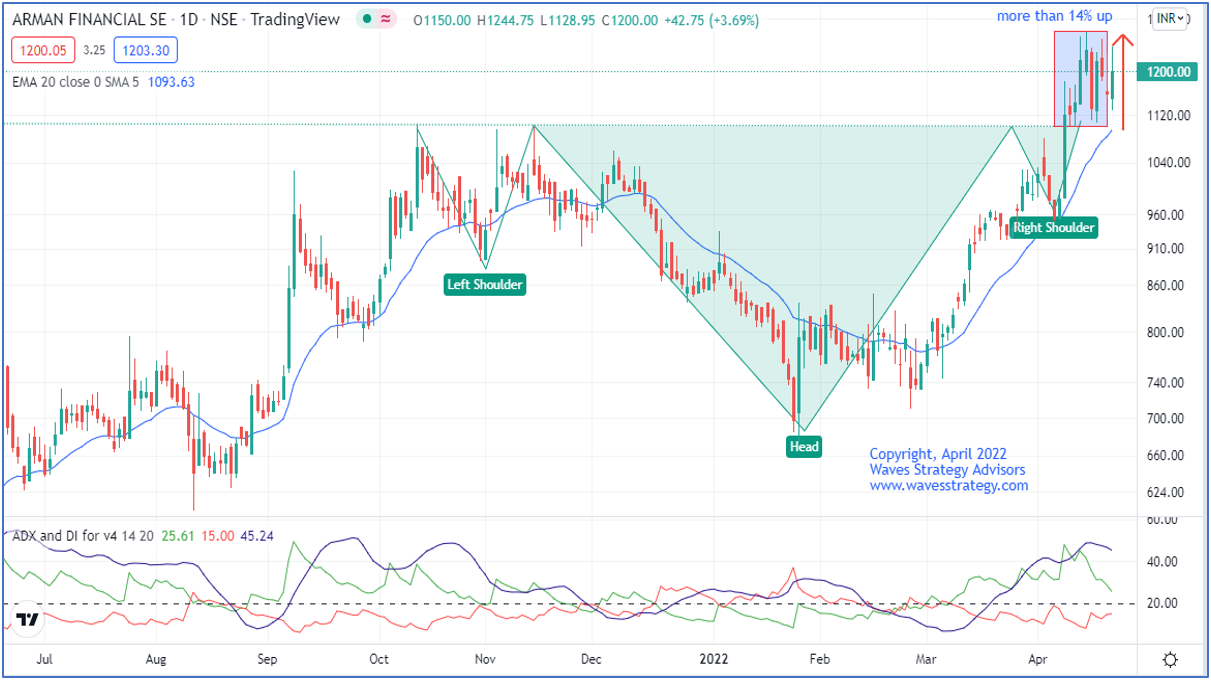
ARMANFIN Daily chart as on 11th April 2022: (Anticipated)

ARMANFIN Daily chart as on 25th April 2022: (Happened)
Waves Analysis as we published on 11th April 2022:
On the daily chart, in the previous session prices formed a bullish candle. The stock has formed a classical inverted head and shoulders which indicate a bearish-to-bullish trend reversal and also suggests an accumulation pattern. Price has closed above 1005 level which confirms a breach of the neckline of the pattern and suggests that it may move higher towards 1280-1300 levels. 20-day period Exponential Moving Average is acting as a brilliant support line and it has provided support at regular intervals.
In short, trend for this stock is positive. Use dips towards 1090-1100 as buying opportunity for a move towards 1280-1300 levels as long as 1050 holds on the downside.
Happened: After we published the report, the stock made a dip exactly towards 1110 levels which we mentioned earlier. Within the short span of time, the stock has given more than 14% return in such volatile market and almost achieved our target by making the all-time high of 1275 levels.
Subscribe to the Equity, Nifty, Bank Nifty calls and receive free research report that will show path ahead from here on. Trade objectively and be thrilled to see much before how the markets can move rather than relying on news or events to take trading decisions. Know more here
Master of Waves Season - 3: Learn complete Elliott wave, Neo wave along with Time Cycles and equip with excellent trade setups along with forecasting the markets from very hour, day and months. 2 Days of Live event on 28th & 29th May 2022. For more details check here OR Contact +919920422202