Apollo Micro Systems Ltd BANG ON!! Rallied by 11%
May 16, 2025
When we combine basic price action with technical indicators like Parabolic SAR and Volume, it can lead to remarkable results in trading. Check out how Apollo Micro Systems Ltd. rallied by more than 11% in just 5 trading session after our report was published.
We published the following research on Apollo Micro Systems Ltd on 12th May 2025 in the “Vayu Momentum Report” which our subscribers receive pre-market every day.
APOLLO Daily Chart Anticipated as on 12th May 2025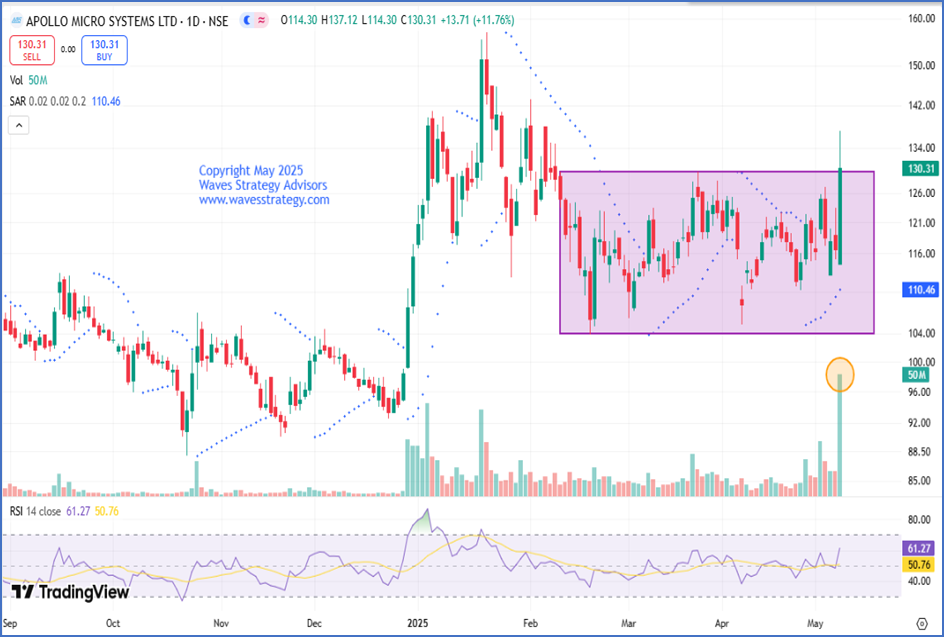 Wave Analysis:
In the previous session, Apollo Micro Systems Ltd surged by more than 11% supported by high volume. The stock had been trading in the broader range of 103-130 levels since past 12 weeks and in the previous session, prices finally gave a breakout of the said range and closed above 130 levels.
On the daily chart, we have applied parabolic SAR which used to determine the price direction as well as draw attention to when the price direction is changing. A series of dots placed below the price which is deemed to be a bullish signal. Post sharp surge, buying on dips appears to be a smart approach to ride the trend with better risk management.
In a nutshell, trend for APOLLO is bullish. Use dips as a buying opportunity for a move towards 143 levels as long as 123 holds on the downside.
Key Resistance: 140
Key Support: 123
Strategy: Use dips towards 127-128 levels as a buying opportunity with the targets of 135 followed by 140 levels with the stoploss of 123 levels.
APOLLO Daily Chart Anticipated as on 16th May 2025 Happened: After we published our report, the stock moved in sync with our expectations. APOLLO showed a rise of more than 11% in just five trading session and BANG ON!! The stock managed to achieve our both targets and made a high near of 141 levels. We successfully captured this entire rise by Price action combined with simple indicators.
It is fascinating to see how accurately combining basic indicators combined with price action can help to predict price targets with accuracy.
Brahmastra (Mentorship) on Timing the market – Equip yourself with tools of Elliott wave, Neo wave, Time cycle, stock selection algo creation, Multibagger and momentum stocks identification along with exact trade setup that actually works. Only a few seats left! Fill below form for more details