Axis Bank: Why Impulsive move provide best trading opportunities?
Mar 24, 2020While trading the market it is important to understand the behavior of the market. We believe that basic as well as Advanced Elliott wave can help to capture the next trend. Axis Banks stock price has seen almost a vertical fall since month of February.
It has been leading the fall this time and yes the movement has been impulsive as per Elliott wave pattern.
It is not very often to see impulsive moves when majority of stocks and indices are moving in complex corrections. This simply shows trading becomes very easy if one can cite such impulsive behavior as predictability increases drastically.
Look at the below chart of Axis Bank published in the equity research report on 17th March morning before markets opened – The Financial Waves short term update
Axis Bank 60 mins chart: (Anticipated as on 17th March 2020)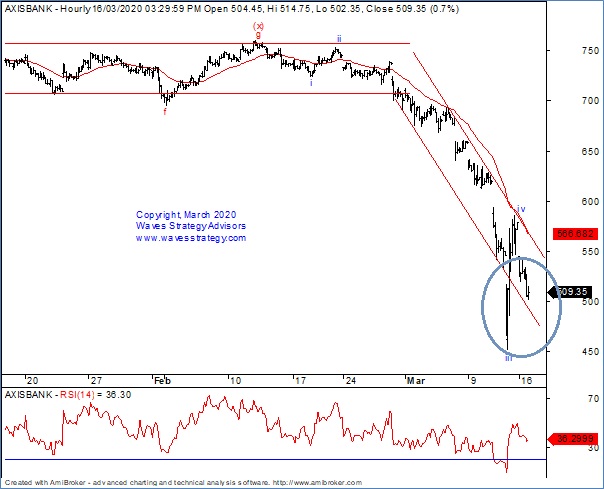
Axis Bank 60 mins chart:(Happened as of now)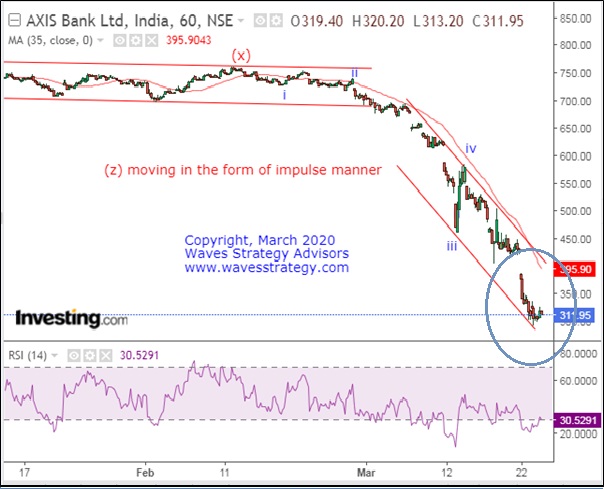
Wave analysis: Following was mentioned on 17th March when the stock was near 510 levels.
Wave analysis:
On the daily chart we can see that, wave (x) completed near 760 levels. Price fell sharply in the form of wave (z). Even after a steep fall in price, we do not see any positive divergence on RSI, showing any signs of reversal. Going by the bar technique we have not seen a single close above the prior day high since the last 11 trading sessions which indicates that the short term trend is bearish and will continue to remain so unless price closes above the high of the prior day.
On the hourly chart, the first leg of wave (z) seems to be moving in an impulsive manner within which we can see that wave v seems to be progressing on the downside. Price is moving well within the falling red channel and also seems to be taking resistance at the 35 hour EMA. As long as price does not decisively break above the EMA we expect price to continue moving lower.
In a nutshell, the trend for Axis Bank is clearly bearish. Price can continue to move towards 455 levels or lower as long as 540 hold on the upside.
Happened: The stock performed precisely as expected recently on 24th March the stock has made its new 52 week low near 291 levels. Currently prices are trading on downside near 300 levels.
To ride the next trend in Indian Equity Markets subscribe to “The Financial Waves Short Term Update” which covers Nifty and 3 stocks with in-depth research. For subscription Contact Us Here
Learn the power of Elliot & Neo wave with Time cycles and equip yourself with tools of technical analysis in the upcoming Online module Master of Elliott Waves, Neo wave with Time cycles (MOW). I will ensure you stop following the news and start trading the charts because this is what is required to be successful. Know more here