Bajaj Finance Bang on with the Help of Advanced Tools!
Jun 12, 2025
Elliott wave when combined with price action leads to interesting results. By using Time cycle and wave theory together it can help predict capture reversals way before it has happened.
New traders want to trade and capture every moves & on other hand seasoned ones know the real money lies in sitting tight and try to capture the best of the 3rd wave.
See the detailed analysis on Bajaj Finance Ltd that we published in our Aakash monthly report on 26th May 2025.
Bajaj Finance Ltd Weekly chart: Anticipated as on 26th May 2025.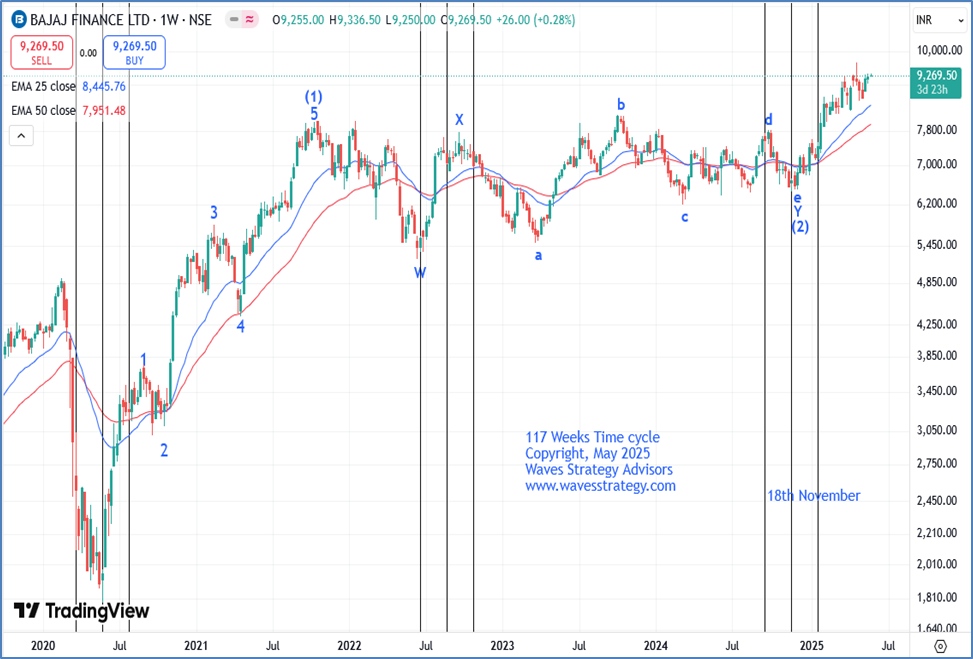 Bajaj Finance Ltd Daily chart with Gann levels: Anticipated as on 26th May 2025
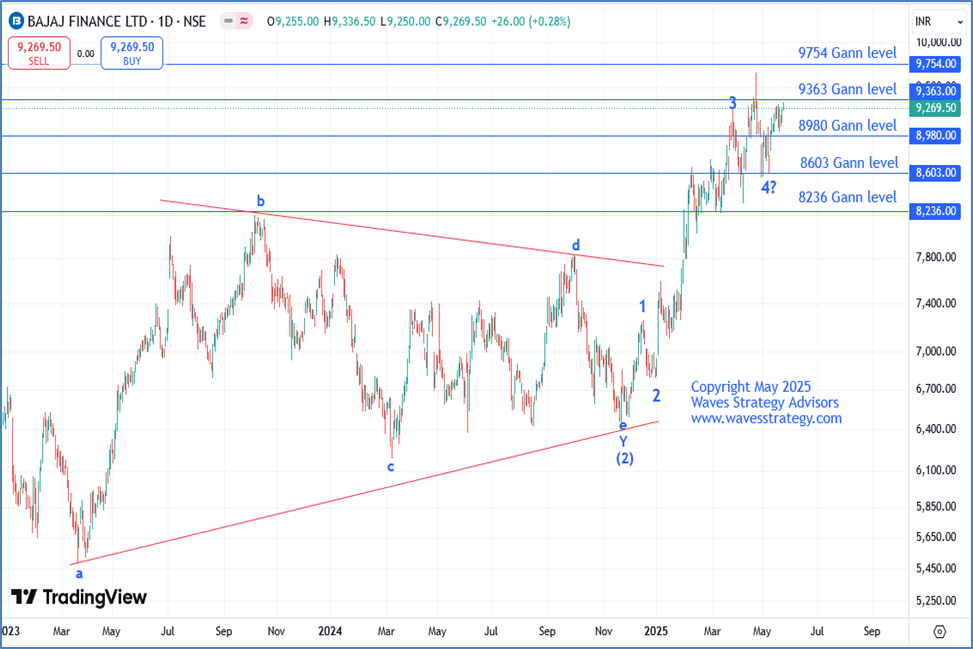 Anticipated wave Analysis as on 26th May 2025
We witnessed a sharp rise in Nifty since the start of April, and it managed to cross the 25k mark in May. In this rally, the financial services sector acted as a fuel. Wherein, Bajaj Finance continued to outperform its sector and its peer companies.
If the RBI announces a rate cut in the forthcoming season, the Auto, Banking, and Finance sectors are likely to be amongst the primary beneficiaries. This hints that the Bajaj Finance has the potential to show a good rise in the coming weeks. Now, let’s understand the detailed analysis from a technical perspective.
Weekly Chart – As per the 3-candlestick rule, the weekly bias has shifted in favour of the bulls. In terms of indicators, we have shown the Exponential Moving Average. We have identified that recently 25- week EMA (Exponential Moving Average) and 50-week EMA have witnessed a bullish crossover, which was in sync with time, and since then prices have resumed its bull run.
117 Weeks’ Time cycle – Time cycle is an advanced tool that can be utilized to identify early reversals and catch the bottom. We have plotted 117- weeks’ Time cycle and it has worked out wonderfully. It has been efficient in capturing almost all the major lows, post which we have seen a reversal on the upside. As of now, the stock has already entered its cycle zone, which was due on 18th November 2024 and from the low’s prices have shown a rally of more than 44%.
Neo wave Analysis – As we can observe that the stock has been moving precisely as per our counts. In which, the Primary wave (1) got completed on the upside in October 2021. Since then, the entire correction was in the form of Primary wave (2), which got completed on the downside in the form of a complex correction pattern (w-x-y). As the current rise have retraced its prior leg in faster time, it suggests that Primary wave (3) has started to unfold on the upside. Now, we are only in wave 1 of (3).
Gann Square of Nine – We extend our study to the Gann square of nine to get further conviction on levels even when prices are in uncharted territory. Wherein, the Gann level of 9363 levels is acting like an immediate hurdle as prices have failed to close above it previously and reversed on the downside from it. Now, a decisive break above 9363 levels can lead to a trending move towards the next Gann level of 9754 levels.
In a nutshell, Bajaj Finance has continued to glitter. The primary trend, according to the Dow theory, remains on the positive side. For now, a decisive break above 9363 levels can resume the rally on a daily basis with the primary target of 9754(Gann level), followed by ???? levels. On the downside, ???? levels is the major support area.
Bajaj Finance Daily Chart: Happened as on 12th June 2025 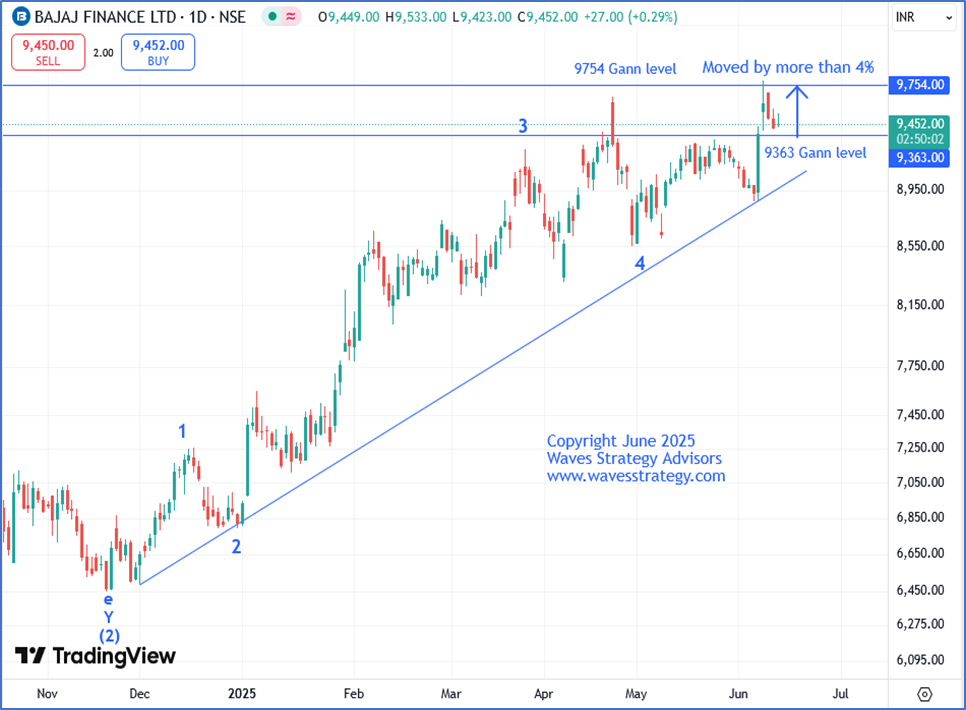 Happened as on 12th June 2025
In our monthly report, we expected Bajaj Finance to show an impulse rise as prices were in Primary wave 3 which is considered as the most trending wave as per the guidelines. Post RBI unexpected interest rate cut by 50 basis points and CRR cut by 100 basis points; Financial services sector was one of the major gainers. Wherein, Bajaj Finance moved in sync with our expectations and BANG ON!!
Prices broke 9363 levels and managed to surge by more than 4% in just one day and achieved our target 1 of 9754 which is a Gann level and made a lifetime high of 9788 levels. We were able to predict this rise before it actually happened using Time cycle, wave theory and Gann square of 9.
Trishul Membership - Transform the way you trade with the power of Neo Wave forecasting, In-depth training on Ichimoku Cloud, Elliott Wave, Master of Technical Analysis and the 5 Mantras of Options.