Bank Nifty - How to Identify a move by combining Elliott wave and Price Indicator
Jun 07, 2023
Like this Article? Share it with your friends!
We had used various advance techniques to catch a current up move in our last month “The Financial Waves Monthly Update” research report. Check out the research we had published on 12th May itself
Bank Nifty Weekly Chart as on 12th May 2023

Bank Nifty Daily chart as on 12th May 2023

Wave analysis as on 12th May 2023
As expected, In the month of April, Bank Nifty too moved higher along with Nifty and showed some outperformance. It managed to gain more than 7% from the low made in the month of April which was near 40535. Currently Bank Nifty is trading at the resistance so it would be interesting to see whether we get a breakout on the upside or reversal back from it.
On the basis of monthly timeframe, we have observed that after a continuous closing below the low of previous candle. In the last month, Banknifty has finally closed above the previous candle’s high which is a positive sign. We have used Bollinger bands to know the nature of price. We can see that the prices have taken support from the mid band and is currently continuously trading near upper band. Any dip towards the mid band can be seen as buying opportunity to the upside. Currently 39600 will act as a medium-term support and as long as price trades above this support overall outlook is likely to stay positive. The correction from 2008-2020 was wave IV unfolding in a form of bow tie diametric pattern and current rise is in form of primary wave v.
On the basis of weekly timeframe, if we draw a trendline starting from September 2020. The prices have perfectly taken support at this trendline and gave a upside move of almost 11%. Currently wave 4 has completed its course on the downside and wave 5 is going on the upside.
On the basis of daily timeframe, after a good up move Banknifty is currently trading in range of 43900 and 42580. If we take a look at the 65 EMA (exponential moving average) it is acting as a perfect support and resistance for the prices in daily timeframe. Currently wave 5 is ongoing on the upside after completing the wave 4.
In a nutshell, the trend for Bank Nifty looks sideways to bullish. The trend looks positive as long as it holds 42580 levels on the downside. If it breaks this support the next support is 42000. On the upside if it breaks 43900 level then further move up towards 44700 level can be seen.
Happened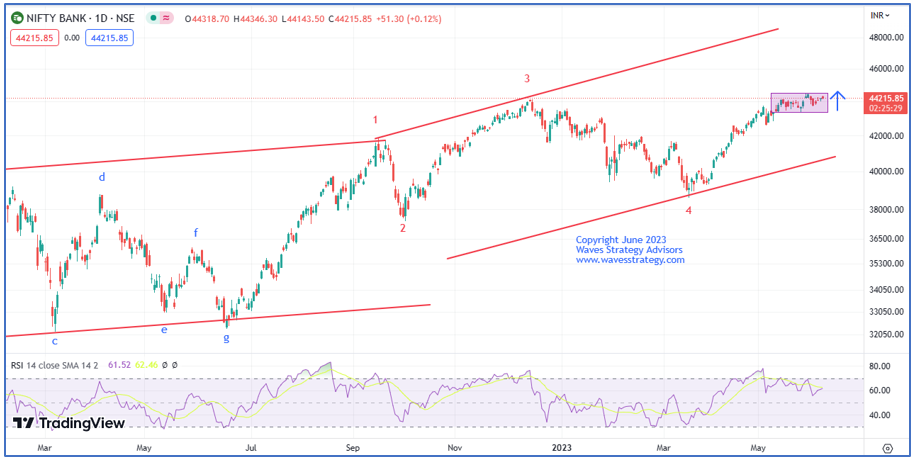
Bank Nifty Daily chart as 7th June 2023
Banknifty moved as we expected and continued to follow buy on dips approach during the last month. Recently index made high of 44498 which is more than 4.5% move. It has potential to achieved our target of 44700. For now, one can continue to use buy on dips approach as long as 43800 holds on the downside.
Master of Cycles (MOC) – is scheduled on 24th – 25th June 2023, where we will discuss clear trade setups using Hurst’s Time cycles, Gann square of 9 and derive trades on Options forming strategies. Limited seats only, Early Bird Ends on 9th June. For more details visit here
Mentorship on Timing the Market – Learn the science of Timing the market over the period of 3 Months along with Live Trading sessions, Algo creation for stock selection, complete trading strategy on Options Masterclass, Neowave with lifetime access to private telegram group. Fill below form for more details: