Bank Nifty Target using Neo wave and Time cycle
Dec 12, 2022
Like this Article? Share it with your friends!
When a index is trading near lifetime high levels very few techniques help to derive a target on the upside.
We had used a multitude of advanced techniques to derive the target of 43500 last month in “The Financial Waves Monthly Update” research report. Check out the research we had published on 14th November itself –
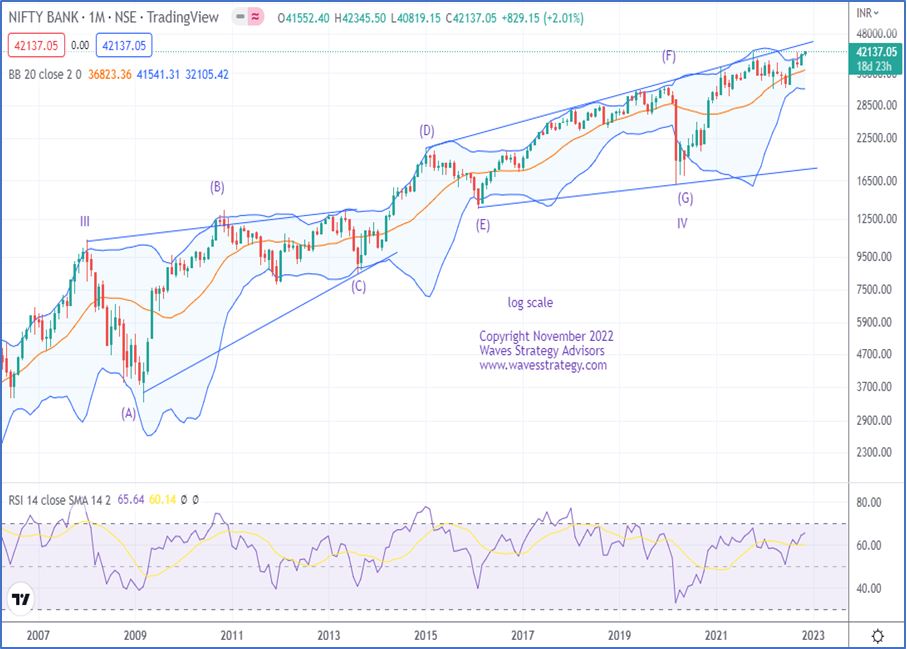
Bank Nifty Monthly Chart:
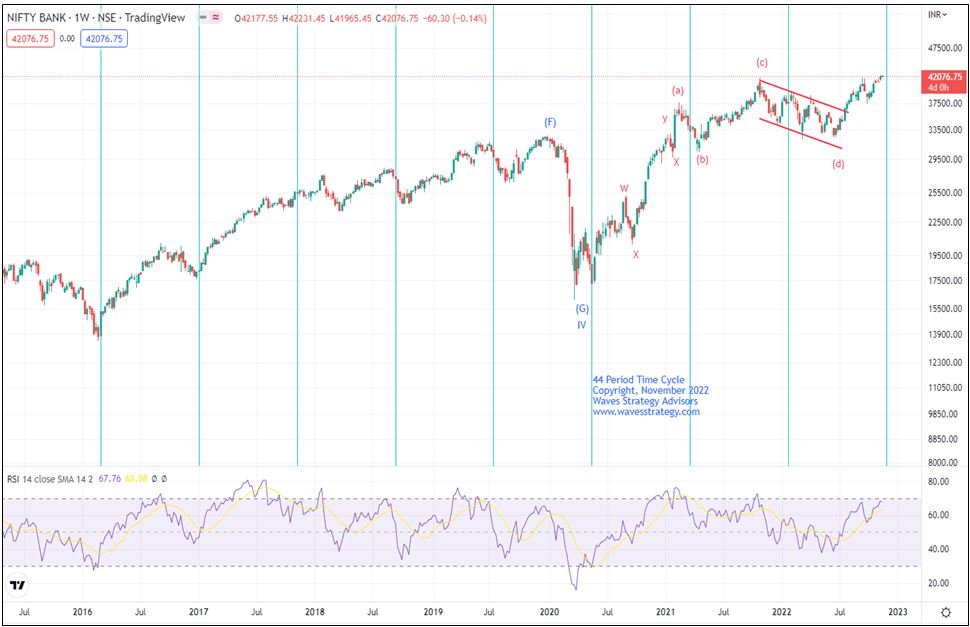
Bank Nifty Weekly Chart
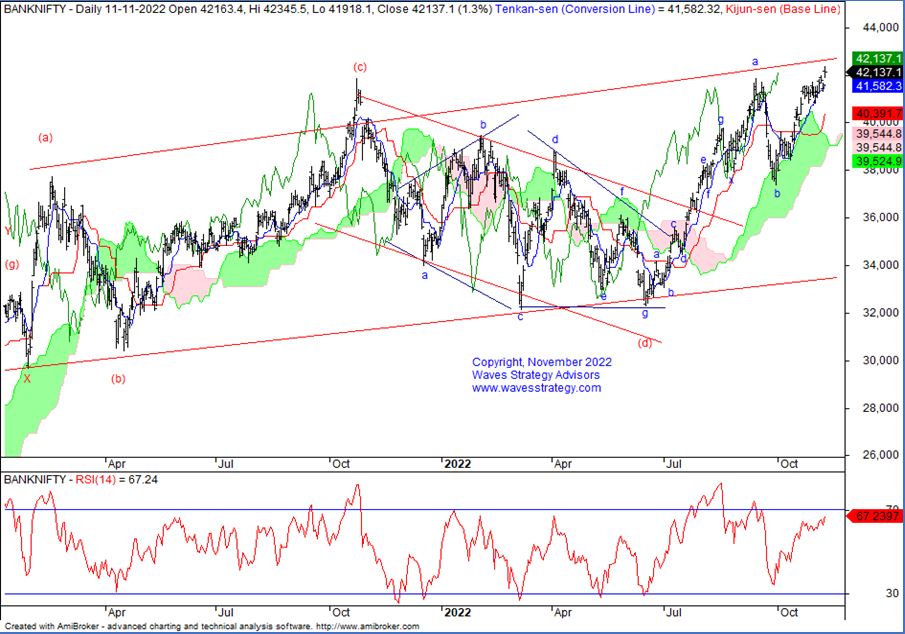
Bank Nifty Daily Chart:
Wave Analysis: (Anticipated on 14th November 2022)
Bank Nifty in the month of October moved higher and showed outperformance. It managed to gain more than 12% from the low made in the month of September 2022 which was near 37386 level. We can see that prices have managed to sustain above all time high and managed to close on the positive note.
Federal Reserve raised interest rates as expected by 75 basis points to cool of inflation. This was fastest tightening of monetary policy since 1980s despite of that global markets has continued to move up.
As shown in figure 7, Bank Nifty post completing wave IV in March 2020 has continued to move higher in non-impulsive pattern. This indicates that prices are in wave V which seems to be forming Terminal or Ending Diagonal pattern.
Monthly Bollinger Bands have worked out extremely well to contain the prices. We can set that during the formation of wave (F) on upside prices failed multiple times to break above the upper end of the Bands. The top made in month of October 2021 is also near this upper end of the Bands. But this time we are seeing prices are trying to breakout above the upper band which further confirms that the Diametric pattern wave (G) completed at the lows of March 2020 and this is wave (1) in upward direction.
44 Weekly Time Cycles: Figure 8 shows weekly chart of Bank Nifty with 44 Period Time cycles. We can see that 44 weekly time cycle has been working exceptionally well in order to catch lows every 44 weeks. The double bottom formed post Covid 2020 fall was also on this cycle. The latest 44-week cycle resulted into low formation after a few weeks post which Bank Nifty consolidated sideways and then rallied back on upside. Now, another cycle is due in last week of November but we need to see a fall prior to that else this cycle can result into an inversion. So, major trend change can be expected near 28th November 2022 as per this cycle.
Neo wave pattern - Weekly chart in Figure 8 shows the entire rise in the form of triple corrective pattern and prices are now in 3rd correction. This third corrective pattern can be forming an expanding triangle as each leg is getting bigger and currently wave (e) is going on. We do not want to catch a top here on Bank Nifty as long as the support near 37500 is protected from medium term perspective.
Channel and Neo wave on Daily time frame - We have applied Ichimoku Cloud to gauge the price direction and to identify the support and resistance levels of the price. We can see that prices are currently trading above the base and conversion line of Ichimoku cloud. Use dips towards the conversion line near 41600 as buying opportunity. As per wave perspective, currently, wave (e) is unfolding on the upside and is nearing the upper channel resistance from where there is possibility of reversal. Resistance of this line is near 42500 and so buying the dips is better risk reward strategy rather than trying to catch the upside breakout.
In a nutshell, Bank Nifty has immediate hurdle near 42500 and close above the same will extend this rally further towards 43500. However, major support is at 40800 levels and as long as same is intact outlook can be buy on dips. Break below this level of 40800 will be first sign of topping out which will complete wave c of (e) and trap the late entrants.
Happened
Bank Nifty daily chart as of (12th December 2022)

As we predicted a month ago, Bank nifty has now crossed above 43500 levels and recently it has made a life time high of 43853.4 levels. For now, one should avoid catching tops and can use buy on dips method to ride the trend by keeping a stop loss of 42300 level.
To know the in-depth analysis from Elliott wave perspective, get access to the “The Financial Monthly Update”. You can also find detailed analysis on Outperforming sectors and Global market views Subscribe here
What are you waiting for to learn this science and practice it yourself? Here is an opportunity to learn about Elliott wave, Neo wave and Time cycles that can give you the edge over everyone else for trading effectively with high accuracy without worrying what the news or events going to be. This will be eye opener sessions on 7th – 8th January 2023 Saturday and Sunday with recordings of 6 hours of video given even before the session starts, post session for Q&A and much more to make you Master of Waves (MOW) by Ashish Kyal, CMT, Author, winner on CNBC TV18, CNBC Awaaz, Limited seats only, Know more here