Berger Paints: Multibagger target Achieved, Classic Impulse Wave
Mar 02, 2020Elliott wave is a classical technique that can help in forecasting of prices and provides very high accuracy if applied correctly. There are times when markets enter into complex correction it becomes difficult and so we apply multiple methods together.
Berger Paints India is one such stock that exhibited classic Impulse wave pattern with a steady rise since the year 2000 onwards and we recommended in our Multibagger research report based on various studies like Time cycles, Elliott wave, indicators.
Below is the chart showing detailed analysis published in our research report -“The Financial Waves Multibagger Update”
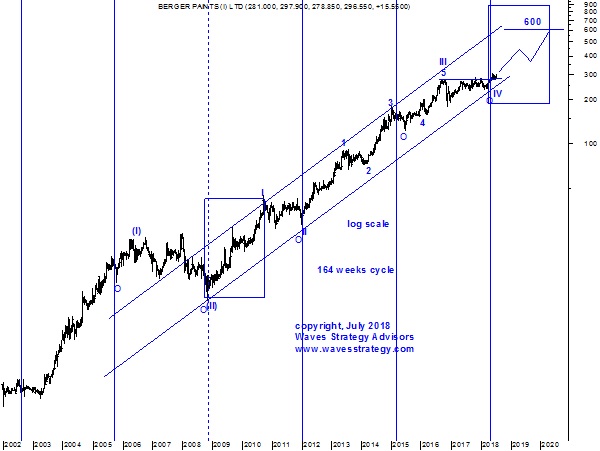
Berger Paints weekly chart: (Anticipated as on 11TH July 2018)
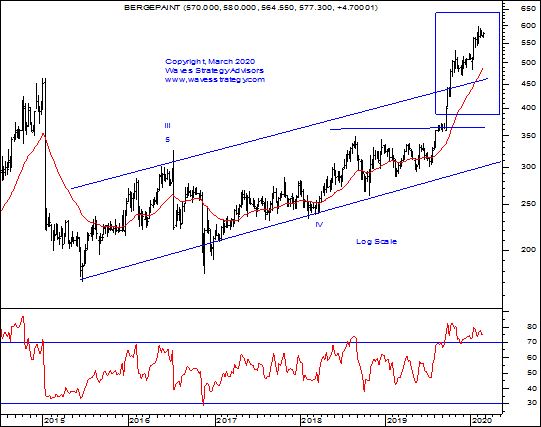
Berger Paints weekly chart: (Happened as on 03rd March 2020)
(Following research is taken from Multibagger report published on 11TH July 2018)
We recommended this stock when it was quoting near the zone of 301 and was successfully able to catch the upmove. It touched its lifetime high near 597 levels on 5th February 2020 which is almost near the target which we mentioned in our report. See yourself how we were able to catch the upmove even before it began.
Multibagger stock recommendation: Berger Paints
Buy Price – Buy at CMP 301 and more on dips to 290
Time Horizon – 1 – 2 years
Investment – 5% of capital
Target price – 600 levels
Stop loss – 205
Anticipated as on 11TH July 2018- Elliott wave perspective: As shown in weekly chart of Berger Paints prices are in cycle degree wave (III) and within this it is now starting wave V of (III) on upside. If we take 61.8% log projection of wave I then there is possibility of seeing the conservative target of 600. Equality target comes much higher towards …. levels but it is best to stay conservative as we are in primary degree wave V.
In a nutshell, one can initiate buy at current levels and add on dips towards 290 levels. Use 205 as strict stoploss as move below it will suggest premature truncation of wave V which looks lower probable scenario. We maintain our target of 600 over the period of 1 to 2 years.
Happened as on 03rd March 2020 – The stock has been moving in sync with our expectation. It has touched its new lifetime high near 597 levels on 05th February 2020. The upmove has been classic and we have almost achieved our target near 597 levels. The stock exhibited 102% returns over 1.5 years of time.
The above analysis clearly shows how one can identify the stocks from positional investment perspective just with the help of Elliott wave, time cycles and other basic indicators. If you wish to build portfolio we can help you with identifying the stocks which can give alpha returns over medium to long term holding period. Click here
So in the upcoming Become Market Wizard comprising of two modules – Master of Technical analysis (MOTA) and Master of Waves (MOW) which will ensure you can learn right from the important indicators to the Elliott wave levels. You can simply register here