BLUESTARCO’s Next Big Move: What Time Cycle & FLD Indicators Are Signalling
Jun 04, 2026
Time cycle is a broader subject which contains different types of cycles such as Lunar cycle, Economic Kondratieff cycle of 54 years, Decennial cycle 10 years, Presidential cycle of 4 years and few concepts such as FLD’s and Pring special K being some of them.
Today we’ll focus on FLD and how traders can use this to identify potential reversal opportunities in any instrument.
Below is the chart of BLUESTARCO with Time cycle and FLD
What is FLD?
- FLD also known as Future Line of Demarcation is an important advance Technical analysis tool that helps us to project price targets, support and resistance points and to understand the underlying trend.
Now to identify FLD we need to plot Time cycle first.
The simplest way of cycle identification is to see if there are low being formed in systematic fashion. There are various tools available to detrend the prices and understand the underlying cyclicality. J. M. Hurst’s has brought forward Hurst’s Cycle analysis which has opened up another realm of looking at markets and timing it right from the smallest time frame to the biggest degree.
Analysis
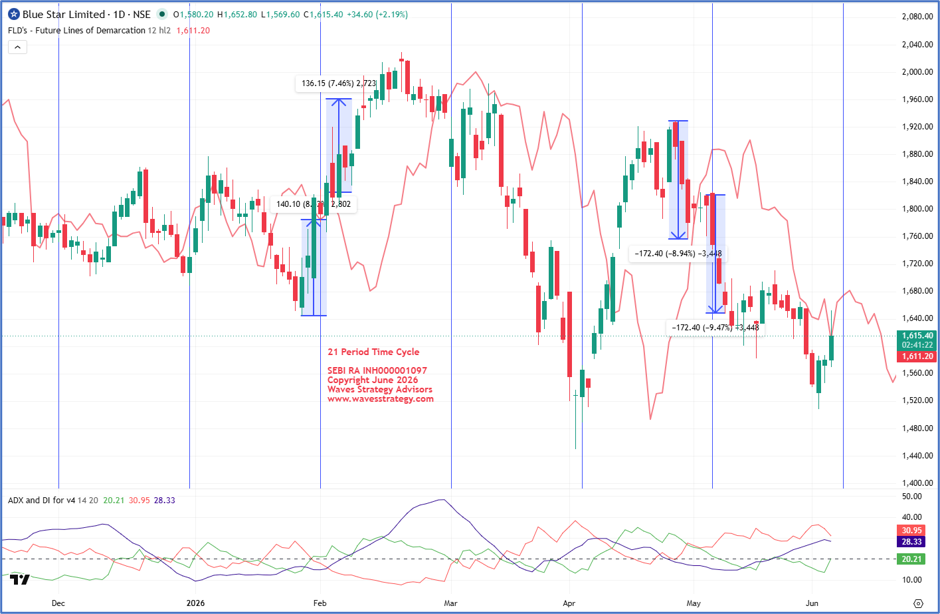
- In the above chart of we Blue Star Ltd we have applied 21 Period Time cycle and FLD of 12 Period.
- Currently BLUESTAR can be observed trading near the FLD crossover with Time cycle due on June 2026. Prices are expected to form a temporary low near the cycle zone and then head higher.
How FLD Projections Worked Previously
Using the FLD, downside projections were calculated from the March 2026 High.
Notice the pattern:
- FLD intersection occurred at the cycle,
- Followed by an downside move that achieved its projected targets.
The same behavior was repeated:
- Near mid April
- Start of May
Each time, FLD interactions aligned with the 21-day cycle, resulting in highly accurate projections.
Current Market Position:
According to this midline, the current cycle date is projected near 08th June. However, timing alone is not sufficient — we also need price confirmation.
Any close above FLD crossover line near 1650 followed by positive price action can be the first indication that the trend is turning upward from the cycle low. Until the above level is taken out, the stock remains in the time cycle zone, and traders should watch for decisive signals.
To know more in depth in how to Calculate FLD for any instrument or want to know more about Time trading and to trade using Gann, Lunar cycles, 2 Stage confirmation, and Pring special K, Know more here
Kalchakra – Bracket Master of Cycles - 4th & 5th July 2026
A rare and powerful training where you will learn:
- Time forecasting along with price targets
- Advanced time cycle techniques
- Integration with Gann Square of Nine
- Sacred market science used by few
Brahmastra Mentorship – Advanced Market Timing
Time the market to the very day, hour, and minute using a powerful combination of:
- Elliott Wave & NeoWave
- Hearst Time Cycle Analysis
- Stock Selection Algorithm
- Practical Risk & Money Management
Brahmastra – 3-Month Mentorship Program
- Learn structured market timing techniques
Fill the form below to know more