Identify Strong Breakouts Using Bollinger Bands.
Dec 13, 2021
Like this Article? Share it with your friends!
Trading breakouts can be tricky sometimes and it's best to use additional confirmation of other indicators to identify strong breakouts. Check out how we recently identified one such breakout in CLEAN.
We published Federal Bank analysis in "The Financial Waves Short Term Update" on 3rd December which our subscribers receive pre-market every day. Check out below the detailed research report that we published.
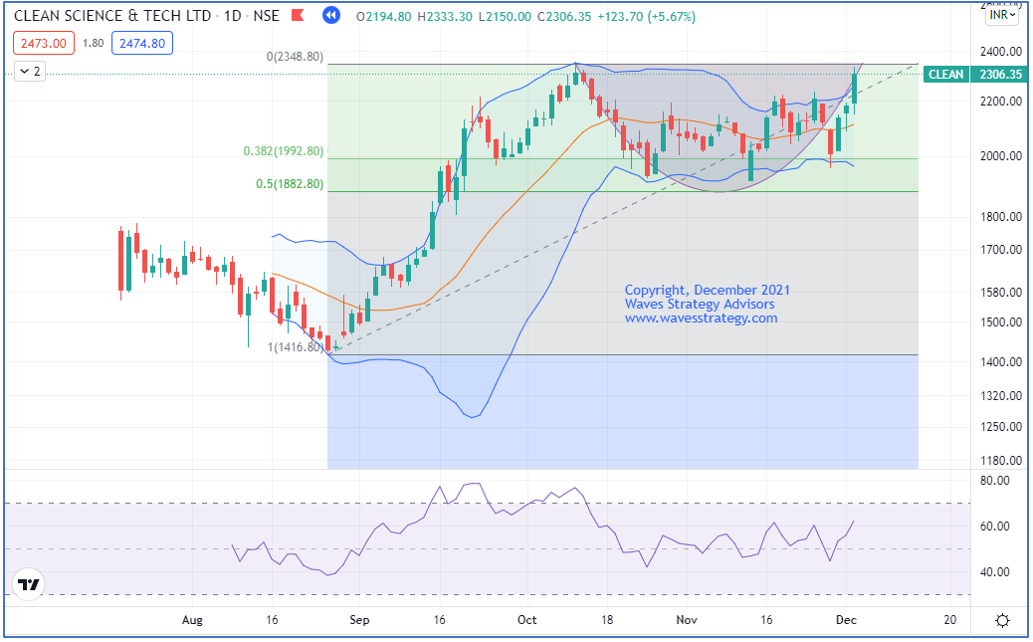
Clean daily chart As of 2nd December 2021 (Anticipated)
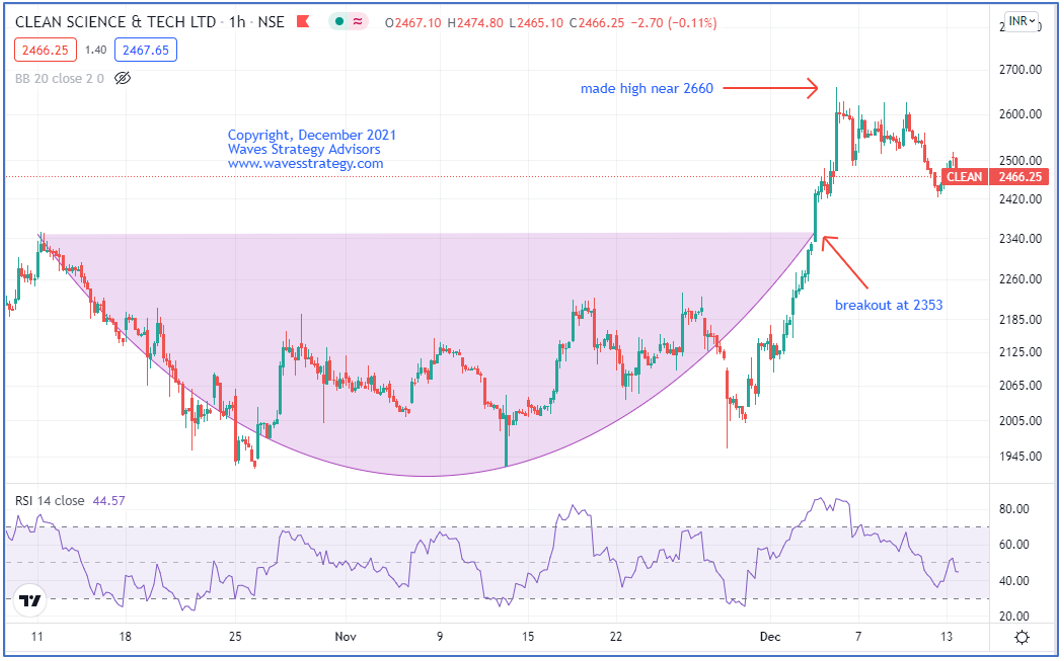
Clean hourly chart As of 13th December 2021 (Happened)
Wave analysis:
On the daily chart, prices retraced 38.2% to 50% of the prior rise and after that, it looks to have resumed the rise. In the prior session, the stock has given close above the upper Bollinger bands which suggests a higher probability of continuation of the up move from hereon. Close above 2355 will further confirm this scenario. On the downside 2140 is the immediate support level.
As shown on the hourly chart, prices have taken out the resistance of 2200 levels and continued to sustain above the same. As per polarity reversal, 2200 will act as strong support now.
In short, the trend for this stock is positive. Use dips towards 2260-2250 as buying opportunity for a move towards 2350-2370 levels as long as 2200 is intact on the downside.
Happened: After we published the report on 3rd December (premarket), prices kept drifting higher and on 6th December the stock hit our target of 2370 levels and made a high near 2660.
Subscribe to the Daily equity research report – The Financial Waves Short Term Update and get insight into Nifty, Bank Nifty, Stocks that are providing good opportunity, and much more. Get access now to be on the right side of the trend over here
Interesting, Isn’t it! By combining Elliott – Neo wave along with Bollinger Bands one can form a clear trading strategy and plan and derive target levels using Fibonacci. Master of Waves (MOW) Live Event on 15th – 16th January, To be a successful trader you need to have an Edge. Along with Neo wave, we will also discuss Time cycles to time the trade to the very hour. Are you in with me! For more details check here