Trading Copper: A combination of Time Cycles and text book Elliott impulse pattern at work!
Sep 10, 2020Copper seems to be consolidating over the last few days and could soon resume the rally if it breaks above important resistance level.
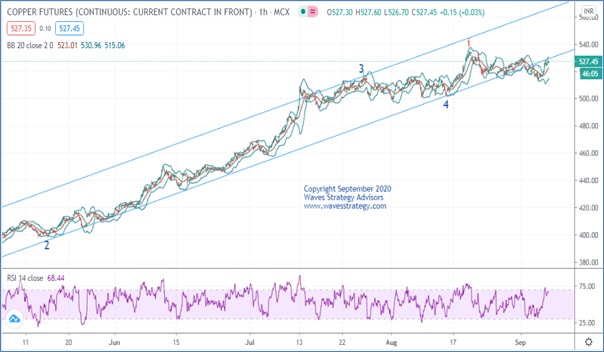
MCX Copper hourly chart:
Wave Analysis:
On daily time frame, we are seeing the impulsive rise of wave 5 wherein the fourth wave got completed near 500 levels and currently the last leg in the impulse pattern is unfolding. The rise has continued to remain within the channel. As per the bar technique the short term bias remains bullish as long as we do not see a close below the prior day low.
On the hourly chart wave ii of wave 5(blue) seems to be ongoing. Price moved below the channel support and has reentered it. A break above 530 can indicate that wave iii may have started on the upside and can take price towards 540 levels or higher.
In a nutshell, MCX Copper can continue to move towards —- levels over the short term if we see a break above — levels as long as 512 support levels hold intact. The medium term bias continues to remain bullish. Note: Use this article for study purpose only.
Ashish Kyal will be taking Limited Seats only as this is the First Ever Training on Cyclical Analysis & Time Forecasting combining Hurst’s and Gann Methods. Only a very few conducts it globally. Know more about Master of Cycles module here
Subscribe to “The Commodity Waves Short Term Update “research report and get latest update on MCX Gold, MCX Silver, Copper and Crude with Elliott wave counts and important levels. For more information ours visit. Pricing page
You can subscribe to the Intraday / Positional calls on commodity via SMS, WhatsApp and get detailed research along with it explaining the clear technical picture. Subscribe Here