Dabur: Giving 51% returns, How to identify Multibagger stocks?
Feb 20, 2020We published about Dabur in April, 2018 and predicted a possibility of Multibagger returns in coming 3-4 years. This stock has managed to outperform the market giving almost 51% returns in over a year time and made a life time high near 523 levels on 12thFebruary 2020
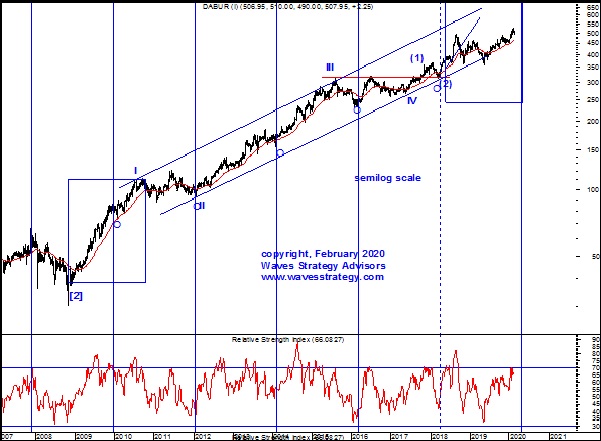
Below is the chart which shows a detailed analysis of Dabur which helped to predict this target levels using Channels, Time Cycles and Elliott Wave technique. We recommended this stock when it was quoting near the 350 levels and was successfully able to catch the upmove. See yourself how we were able to catch the upmove even before it began.
Below is the chart showing detailed analysis published in our research report -“The Financial Waves Multibagger Update”
Dabur Weekly Chart: (Anticipated as on 18th April 2018)

Dabur Weekly Chart:(Happened as on 20thFebruary 2020)
(Following research is taken from Multibagger report published on 18th April 2018)
Multibagger stock recommendation: Dabur
Buy Price – 340 – 350
Time Horizon – 1 – 2 years
Investment – 5% of capital
Target price – ???
Stoploss – ???
Anticipated as on 18th April 2018:
Elliott wave perspective: As shown in weekly chart of Dabur, from 2012 to mid-2016 prices moved higher from the levels of 92 to 316 levels in the form of primary wave III which is more than 240% increase. After the strong bull run this stock was contained within a consolidation and prices drifted lower from the high of 316 levels to 265 levels in the form of wave IV.Post which prices completed wave (1) of wave V at 365–levels followed by wave (2) of wave V at 316-levels and currently wave (3) of wave V is on-going on upside.
…weeks cycle: It is now time to look at the bigger cycle in order to understand the probable reversal areas from medium term perspective and we can observe that exactly at the cycle day important bottoms are formed. Following which prices have shown sharp rise and touched all-time high. As per …weeks cycle, stock has made a low at 316-levels which also happens to be the support level which was resistance earlier as shown in the figure. This shows that going forward, prices have high probability of giving a sharp rise.
Channelling technique: Since 2012, prices are intact in upward moving blue channel. This channel shows that there is huge space on upside which indicates that the stock has high potential to move northward.
In a nutshell, various indicators like Time cycle, Exponential Moving Average, Elliott wave counts and channel technique suggests that we can expect this stock to rally towards ….levels over next 1 to 2 years with ….as very important support which is the level of start of wave V on upside
Happened as on 20th February 2020 – The stock has been moving in sync with our expectation and currently quoting near 511 levels. It has touched its new lifetime high near 523 levels on 12thFebruary 2020. The upmove has been strong and we expect prices to achieve its target of …..levels in coming months. The stock is giving a return in excess of 51% in just One year of time
As a long term buyer of equity one should not wish for market to go up in straight line. It’s the volatility that creates opportunity to earn exponential returns. Get access to our Multibagger report to know here to invest next! That will help you capture such strong trend and earn exponential returns even in such market conditions. Check here.
So, how to trade right from scratch of understanding the context of market, Price action, plotting a chart to the indicators to Elliott wave, Neo wave, Time forecasting dates and much more in the upcoming Become Market Wizard. Get the complete details here