Dr. Reddy Showing Classic Impulse Wave Rise.
Sep 21, 2020You are seeing the best of Pharma sector stocks rally since past 3 trading sessions. We have been bang on in anticipating this up move in Dr. Reddy. Also you can listen my recent webinar has the explanation of this rise watch here
Given the upward momentum we capitalized on stocks which were ideal to trade for 12% – 15% returns in this index favourable rally.
Dr. Reddy was one of the stocks in Pharma sector moved amazing as per Elliott wave patterns and also indicators such as Bollinger Bang hinted towards the target levels.
We generated buy call under Momentum Stocks on Dr. Reddy on 16th September 2020 and we achieved out target level as our studies showed.
See below what did the chart suggests:
Dr. Reddy hourly chart: Momentum call given on 16th September 2020
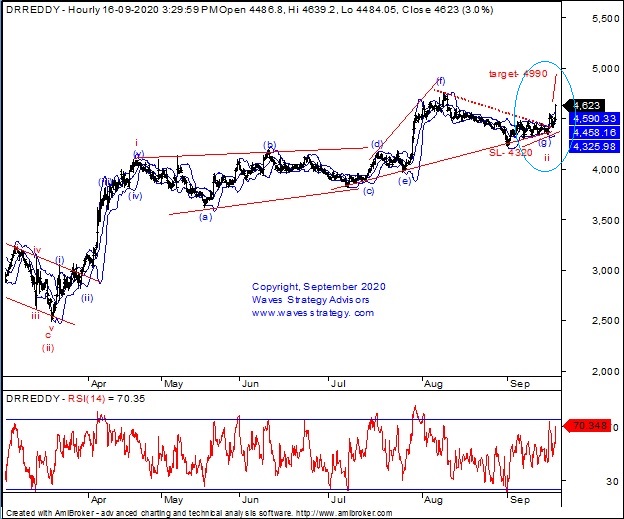

Momentum stock recommendation: Dr. Reddy’s Laboratories Limited
Buy Price – Buy above 4550
Time Horizon –Not Applicable
Investment – 5% of capital
Target price –4990
Partial Profit: 4730
Despite there was the news of RDIF and Dr. Reddy’s tie up to manufacture coronavirus vaccine Sputnik V for India which could be great boon for the company fundamentally. However amidst this news our wave theory already suggested before it’s happening the up move as we are moving in wave iii of impulse pattern.
On the hourly chart of Dr. Reddy we are seeing the impulse pattern formation. Wave 5 of primary degree is ongoing on upside. Within which wave (iii) red is ongoing wherein wave ii red has been terminated near 4300 levels which was forming diametric pattern. Currently wave iii red is in progress which means we are seeing power of impulse wave iii of (iii) which is strongest and largest and will strengthen the prices to reach our target levels of 4990 levels at minimum if not higher which is also the channel resistance.
As per Bollinger Bands, prices have started rising post taking support of middle Bollinger band and since the stock is closed above the upper Bollinger band so our bias remains positive as of now. As long as lower band is intact on downside which is near our stop loss i.e. 4320 levels prices can continue to move higher.
In short, trend for Dr.Reddy looks to be positive for now. As prices have decisively broken above 4550 we expect it to reach a target of 4990 based on our analysis. But book partial profits near 4730 level to ensure risk is reduced and trail the stop loss of the remaining position at cost i.e. 4550. The initial stop loss is 4320 and view remains valid as long as this level remains protected.
Happened: The stock rallied more than 20% in just three trading sessions and we achieved our target at 4990 levels post which prices have moved much higher towards 5512 levels the new 52 week high in today’s session. It simply shows power of Elliott wave patterns that we use for most of our research.
Momentum calls: During such times it is important to capitalize by buying the stocks that can show momentum along with broader market. Always remember not every stock will move the way we expect but it is important to maintain strict stoploss as these are high risk trades but with potential to give the max gain in shortest possible time. Gets access now as the momentum starts building UP.
Master of Cycles (MOC) For the very first time Ashish Kyal, CMT will be sharing his decade of research on Time Forecasting and Cycle analysis for more than 12 hours of program using Gann square of Nine and Hurst’s Time Cycles on 26th – 27th September 2020, Register here or Contact +919920422202