GINNIFILA: Price Action with powerful Indicators for strong returns
Dec 28, 2021
Like this Article? Share it with your friends!
Using indicators along with price action techniques gives better confirmation and increases the accuracy of the analysis. We have shown here how we have analysed GINNIFILA stock using price action and indicators.
We published the following research on GINNIFILA pre market on 17th December 2021 in "The Financial Waves Short Term Update” which our subscribers receive Pre-market every day report.
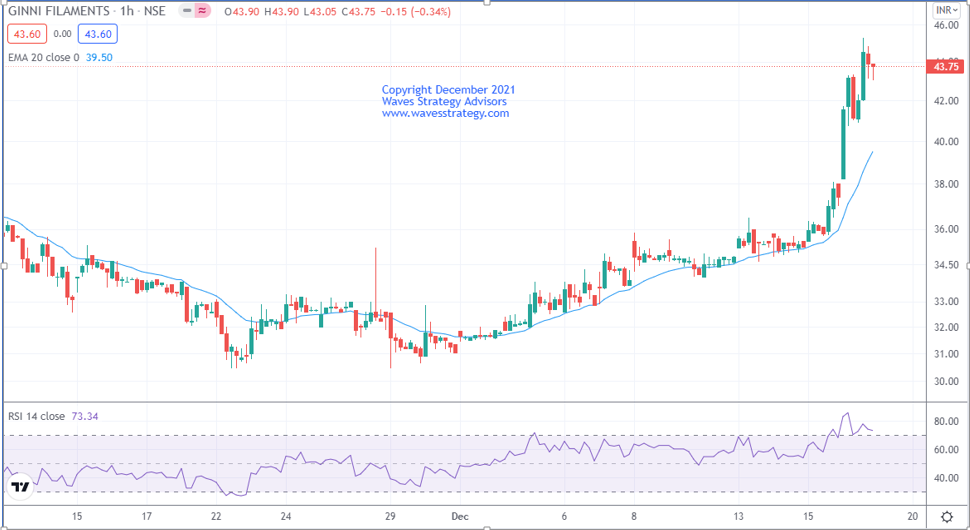
GINNIFILA Hourly chart as on 17 December 2021 (Anticipated)
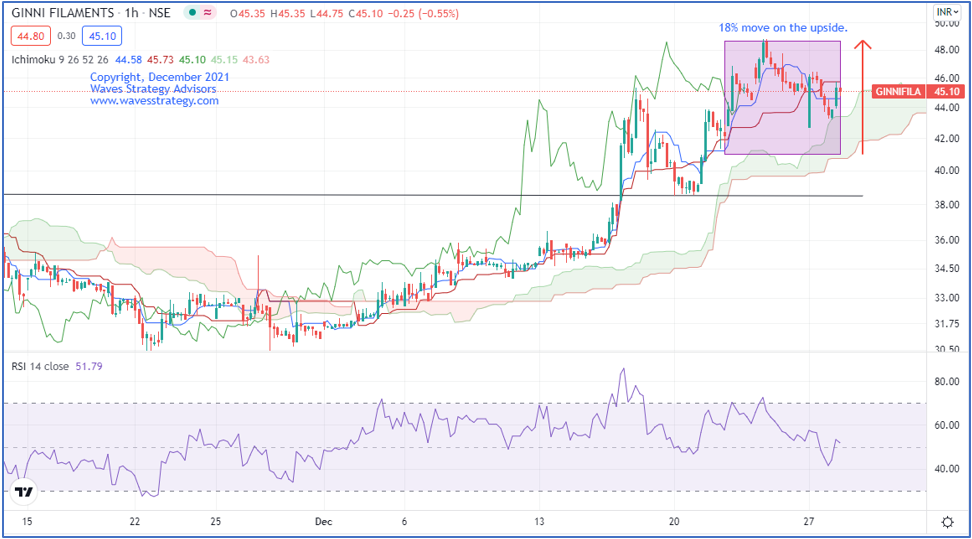
GINNIFILA Hourly chart as on 28 December 2021 (Happened)
Waves Analysis as we published on 17 December 2021:
As shown on the hourly chart, 20 periods Exponential Moving Average is acting as a brilliant support line and it has provided support at regular intervals. This suggest that one should be in the direction of the ongoing trend as far as this line is protected. Closest support is placed at 38 levels.
In short, trend for this stock is positive. Use dips towards 42-41 as buying opportunity for a move towards 46-47 levels as long as 38 holds on the downside
Happened: After the report was published, the price took the retest from its previous support level and continued to move higher. The Ichimoku cloud was also supporting the price. Within the short time, the stock has given more than 18% return and achieved our target of 47 levels.
Festive Special Offer - Get access to the Monthly research consisting applications on charts and how you can ride the trend using simple powerful Wave theory, Act NOW! Subscribe here
Master of Waves – Learn complete Elliott wave, Neo wave along with Time Cycles and equip with excellent trade setups for trading Intraday and positional along with forecasting the markets from very hour, day and months. 2 Days of Live event on 15th – 16th January 2022, Know more here