Gold – Is it Time to BUY?
Apr 26, 2022
Like this Article? Share it with your friends!
Time Cycles is a very important Technical Analysis study as it helps us to capture the important lows and ride the trend later.
Look at the below charts with the application of Time Cycles on Daily Time Frames applied on Gold Mini.
Let us see more in detail
Gold Mini Daily Chart- 51 Days Time Cycle
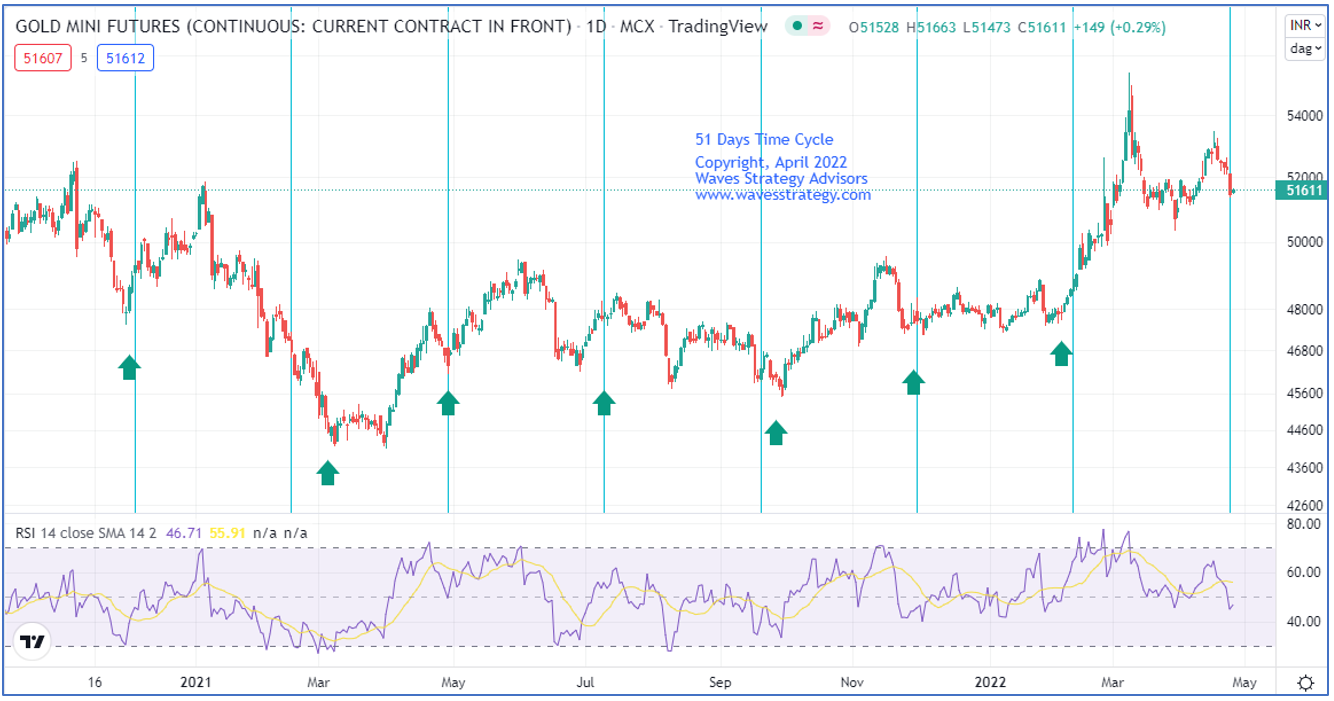
On the daily chart of Gold Mini, the vertical lines represent the 51 Day time cycle which we have identified on this time frame. Notice how after every 51 days near the vertical line an important low is formed with a slight variation of one of two bars.
As prices start to move lower close to the time cycle day we can use the bar technique to enter at the right levels I.e The first candle after the time cycle low formation which closes above the high of the prior day can be used as buy signal.
A stop-loss can be placed below the swing low formation and one can ride the trend on the upside as long as the price does not close below the prior day low.
The gold cycle is due in next one or two days, so let us see if we can get any reversals in the gold.
Subscribe to the Commodity calls and receive free research report that will show path ahead from here on. Trade objectively and be thrilled to see much before how the markets can move rather than relying on news or events to take trading decisions. Know more here
Master of Waves Season - 3: Learn complete Elliott wave, Neo wave along with Time Cycles and equip with excellent trade setups along with forecasting the markets from very hour, day and months. 2 Days of Live event on 28th & 29th May 2022. For more details check here OR Contact +919920422202