HUL: How to trade using advanced indicators like Parabolic SAR with ADX
Feb 17, 2020HUL is one of India’s foremost multi-business enterprises. The stock has shown an exponential rise in the form of wave 3. We have been applying Elliott wave theory to forecast the prices. The stock has given amazing returns over the years making it one of the most preferred stock for investors.
Below is the chart we published in our monthly report, “The Financial Waves Monthly Update”
HUL Weekly chart: (Anticipated as on 8th August 2019)
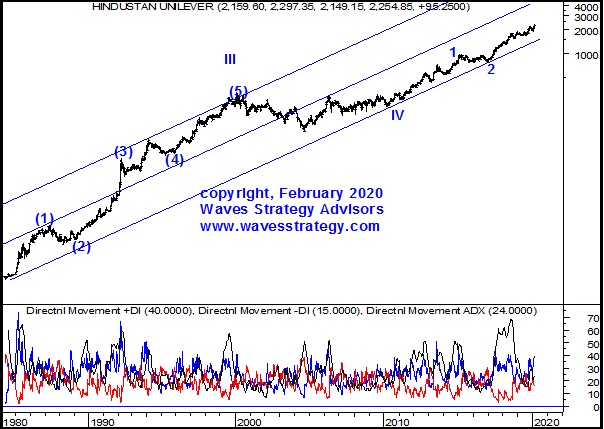
(Below is the extract of the research from our Monthly report)
Elliott Wave analysis: As shown in the weekly chart the prices have shown an excellent rise and are moving precisely within the multi-year channel. Currently we are seeing impulsive wave V of primary degree on-going within which strongest wave 3 is taking the prices to higher levels.
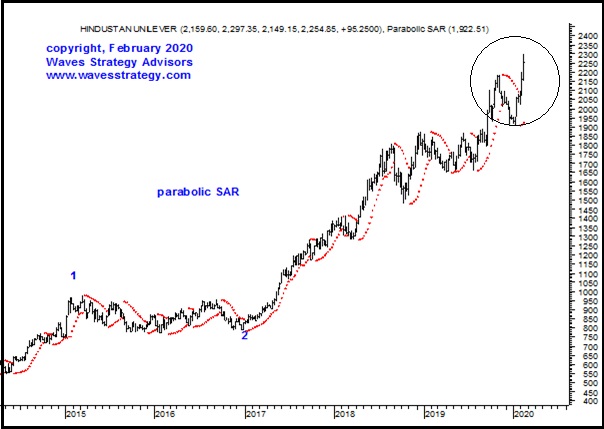
Indicator Analysis: We have used Parabolic SAR indicator with ADX indicator on the weekly chart. The Parabolic SAR indicator is considered a good timer indicator that uses trailing stop-and-reversal method to determine appropriate exit and entry points. Basically, if the stock is trading above the parabolic SAR one should buy or stay long & if the stock price is trading below the SAR then one should sell; whereas the ADX indicator shows the strength of the trend and also confirms the direction with respect to the Parabolic SAR indicator. When the ADX rises and shows a strong trend one should use a trailing stop loss that’s where Parabolic SAR helps in identifying the trend and trailing it.
On the chart we can see that the SAR is above the price and price is moving closer towards it. We can see the +DMI (Directional Moving Index) is about to cross above the –DMI and the ADX is quoting near 12.60 levels which indicates positive momentum is about to build up in the stock. As price breaks above The parabolic SAR and +DMI crosses above – DMI long positions can be initiated and one can stay bullish as far as both indicators support the uptrend.
Overall HUL looks to be in strong up move. So for the stocks that are in uptrend and exhibit a good Elliott wave structure it is best to buy them on dips. The medium term target for this stock can be maintained at 2200 levels.
Happened – Post recommending the stock prices are moving in line with our expectations and achieved the target of 2200 levels. The stock made its new 52 weeks high near 2297 levels on 14th February 2020 levels
To view complete details get access to the monthly research report – The Financial Waves monthly update
Upcoming Seminar: I will be discussing all of the above methods on how to identify patterns and combine them with important indicators and Elliott wave, Neo wave theory, Hurst’s Time cycles Only limited seats, Register now for Most advanced training on Technical analysis Ever – know more here