ITI: How simple technical tool can give us 12% move in a day
Jun 23, 2022
Like this Article? Share it with your friends!
It is possible to capture massive moves in stocks using price patterns along with simple indicators like the Ichimoku cloud
We used these 2 indicators on ITI and were able to capture a 12% move in a short span. You can also use these to identify stocks with momentum for short-term trades.
We published ITI analysis in "The Financial Waves Short Term Update" on 23rd June 2022 which our subscribers receive pre-market every day. Check out below the detailed research report that we published.
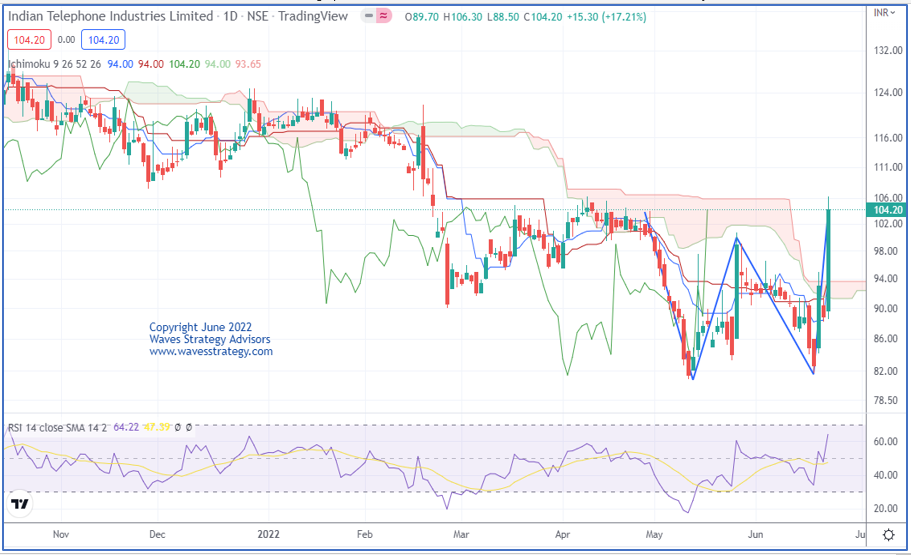
ITI as on 22nd June 2022 (Anticipated)
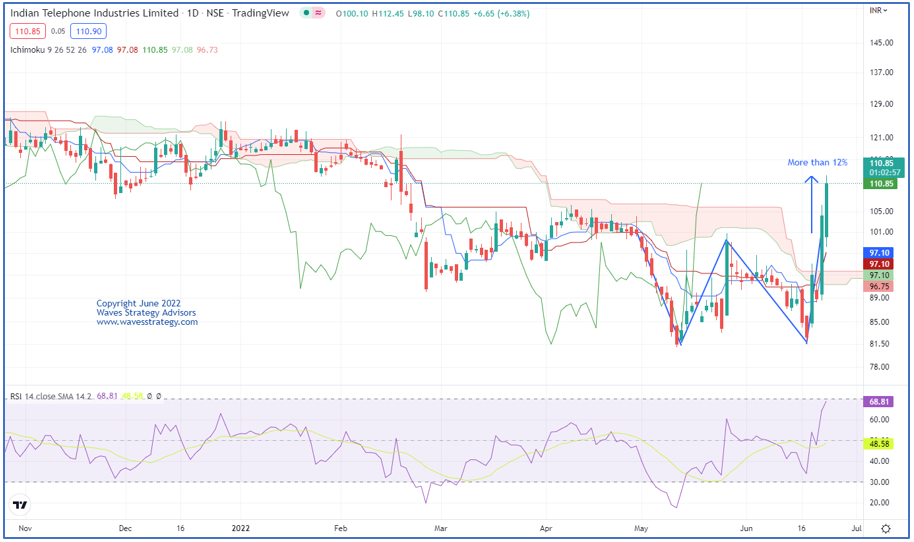
ITI as on 23rd June 2022 (Happened)
Wave analysis as we published on 23rd June 2022
On the daily chart, in the previous session prices formed a bullish candle. A double bottom pattern is a technical analysis charting pattern that describes a change in trend and a momentum reversal from prior leading price action. The double bottom looks like the letter "W". Price is trading above the ichimoku cloud which indicate that the short-term bias is bullish.
In short, trend for this stock is positive. Use dips towards 100-102 as buying opportunity for a move towards 115-117 levels as long as 96 holds on the downside.
Happened
Stock has opened with a dip towards 98.10 and continued to move higher from the opening candle itself and made a high of 112.40 that is 12% up from above mentioned levels, Formation of double bottom pattern on the daily chart and prices giving break above the Ichimoku cloud gave us a double confirmation of the breakout. In such volatile session price has managed to give 12% returns in just one day.
Master of Cycles – Learn the science of Trading using Hurst’s Time cycles, Gann square of 9 and forecast prices using Time. Time can be the missing element in your trade setup that can drastically change the way you trade, Limited seats only, Early Bird Ends soon – know more here
Mentorship on Timing the markets – Learn the science of Timing the market over more than 3 months with lifelong association, live trading sessions, Algo creation and everything focusing on Time trading. Fill below form for more details.