JSW Steel: Know the All- at Once Technical behind the up move
Jul 29, 2020JSW Steel was suggesting the up move 10 days earlier its happening with the help of Elliott-Neo wave corrective 7 legged Diametric pattern along with Ichimoku and most basic channels and EMA confirmed the positive direction up move.
I will be talking about these methods in much detail on how to select momentum stocks using Ichimoku Cloud, Neo wave, in the upcoming training on Master of Waves
Look at the below chart of JSW Steel published in the equity research report on 20th July morning before markets opened – The Financial Waves short term update
JSW Steel Daily chart: (Anticipated as on 20th July 2020)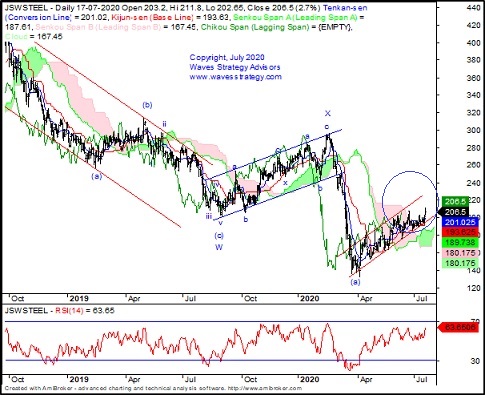
JSW Steel Hourly chart: (Happened as of now)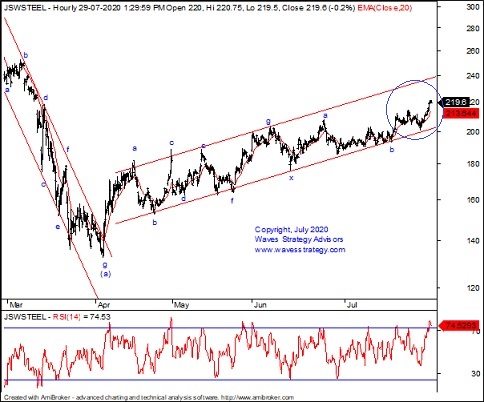
Elliott Wave analysis: Following was mentioned on 20th July when the stock was near 206 levels.
On the daily chart, as per wave count entire wave is forming the complex corrective pattern wherein wave Y is under formation within which wave (b) is in progress in an overlapping manner which is in the form of Diametric pattern. To continue with up move, break above prior day high near 211 on closing basis is required. Since Ichimoku cloud has given the indication of positive movement as prices have broken above the cloud. Also it has bounce off from the channel support giving the strength and space to move in upward direction.
As shown on the hourly chart, entire wave (b) is moving in well channelized manner. Internal count of wave (b) suggests that wave b has been terminated near channel support and currently wave c blue seems be unfolding on upside. The 20 hour moving average is acting as short term support.
In short, JSW STEEL looks to be positive for now. Break above 211 will take prices higher towards 220. This outlook remains valid as long as 195 is protected on downside.
Happened: JSW Steel has showed precise movement as expected and suggested by Ichimoku cloud and Wave counts. The stock today’s intraday high made near 220.95 levels. These levels were fore casted weeks ago even before its happening using basic and advance technical methods applied across daily and hourly time frames as you can see in above research.
To know the next trending moves subscribe to “The Financial Waves Short Term Update” which covers Nifty and 3 stocks with in-depth research using Elliott wave. You can subscribe in less than 2 minutes over here
You can subscribe to our Intraday/ Positional calls advisory and get free daily equity research report along with it. See the details here
Get access to the Multibagger, Momentum stocks which provide exact entry and exit based on advanced methods with clear explanation on charts. Contact us on +91 9920422202 or over here
Learn the power of Elliott & Neo wave with Time cycles and equip yourself with tools of technical analysis in the upcoming Online Master of Elliott Waves, Neo wave with Hurst’s Time cycles (MOW). Know more here