JSW STEEL- Price targets using Elliott wave!
Dec 19, 2022
Like this Article? Share it with your friends!
We published about JSW Steel in June 2022 and predicted a possibility of good returns in the coming months in our Monthly Research report. Check out the research we had published on 14th November itself – This stock has managed to hold its gain and gave almost 34% returns in less than 6 months of time and made a high of 762.9 levels.
Below is the chart which shows a detailed analysis of JSW Steel which helped to derive targets of 630 levels using Elliott Wave technique and Time cycle. We recommended this stock when it was trading near 560 levels and was successfully able to catch the up move.
JSW STEEL weekly Chart (Anticipated on 14th December, 2022)
JSW STEEL Daily chart: (Anticipated on 14th December, 2022)
Wave analysis anticipated on 14th December, 2022
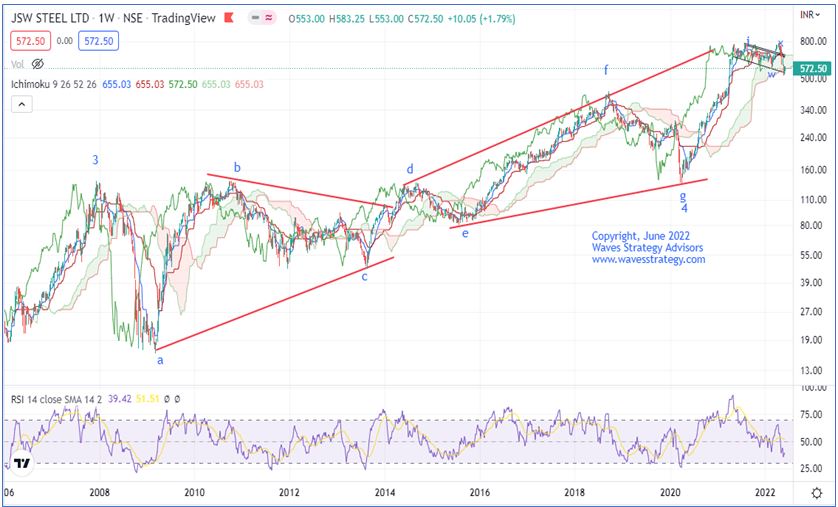
On the weekly time frame, JSW Steel is moving in the impulse fashion since 2005 in which primary wave 5 is moving on the upside. The internal rise is marked corrective as wave 5 seems to be forming Terminal pattern and prices are currently in wave 2 of primary wave 5. On the weekly chart, we have applied Ichimoku cloud to gauge the stock direction. Prices are currently trading within the ichimoku cloud which indicates sideways or in range movement. A break above the cloud is essential for the trending move.
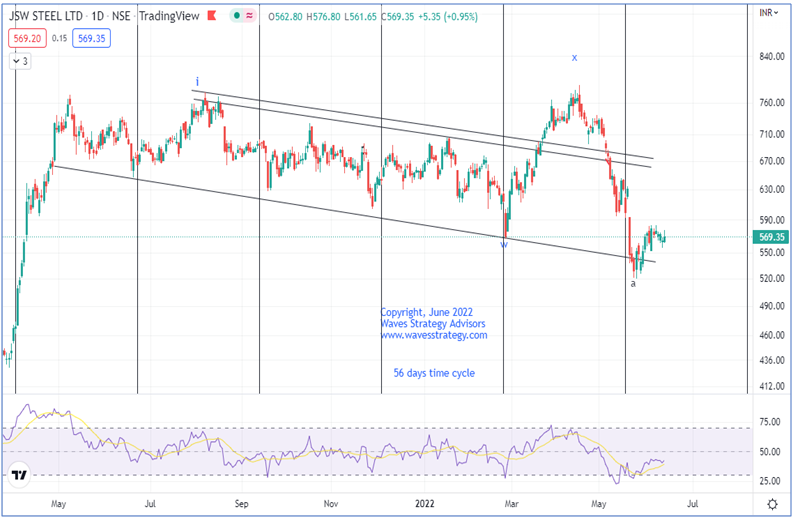
On the daily chart, prices are moving in the falling channel. The stock is currently trading near the support levels. Here, 56 Day Time Cycle is working extremely well as it helps to capture the major lows. We can see that the cycle has formed and until the cycle low does not taken out, the trend can continue to remain sideways to bullish. As per wave perspective, internal of wave ii is moving in complex correction in which wave a of y might have completed on the downside but further price movement is required to confirm the same.
In a nutshell, as of now the trend is positive. Over next few days if 520 remains protected stock can move towards 630 levels. Any breach below 520 will indicate deeper downside correction can start as it will also breach the low of cycle.
Happened
JSW STEEL DAILY CHART as on 19th December, 2022
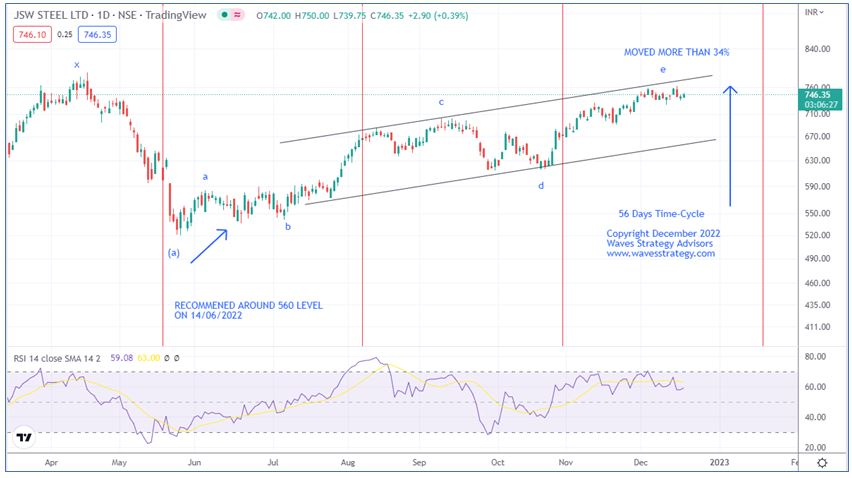
As we predicted 6 months back if this stock holds 520 levels on the downside then a good rally can be seen with the targets of 630. This tock has managed to surpass our target level of 630 and recently made high of 762.9 which is more than 34% move in less than 6 months of span. This up move we have been able to capture with the help of Elliott wave, Time cycle along with price action.
For now, primary wave (b) is unfolding on the upside within which prices are moving in form of Diametric pattern. After a rally now we can expect short term correction in form of wave f. Post completion of which again a good up move can be seen.
To know the in-depth analysis from Elliott wave perspective, get access to the “The Financial Monthly Update”. You can also find detailed analysis on Outperforming sectors and Global market views Subscribe here
What are you waiting for to learn this science and practice it yourself? Here is an opportunity to learn about Elliott wave, Neo wave and Time cycles that can give you the edge over everyone else for trading effectively with high accuracy without worrying what the news or events going to be. This will be eye opener sessions on 7th – 8th January 2023 Saturday and Sunday with recordings of 6 hours of video given even before the session starts, post session for Q&A and much more to make you Master of Waves (MOW) by Ashish Kyal, CMT, Author, winner on CNBC TV18, CNBC Awaaz, Limited seats only, Know more here