KPITTECH - How to Identify the trade by combining Elliott wave and Time cycle
Jun 22, 2022
Like this Article? Share it with your friends!
Elliott wave helps us to navigate the trend of the market. Moreover, Time Cycles is a very important Technical Analysis study as it helps us to find the entry in trade and ride the trend. Here, we have shown an example by combining wave counts and time cycle on KPITTECH to understand the trend well in advance.
KPITTECH Daily Chart:
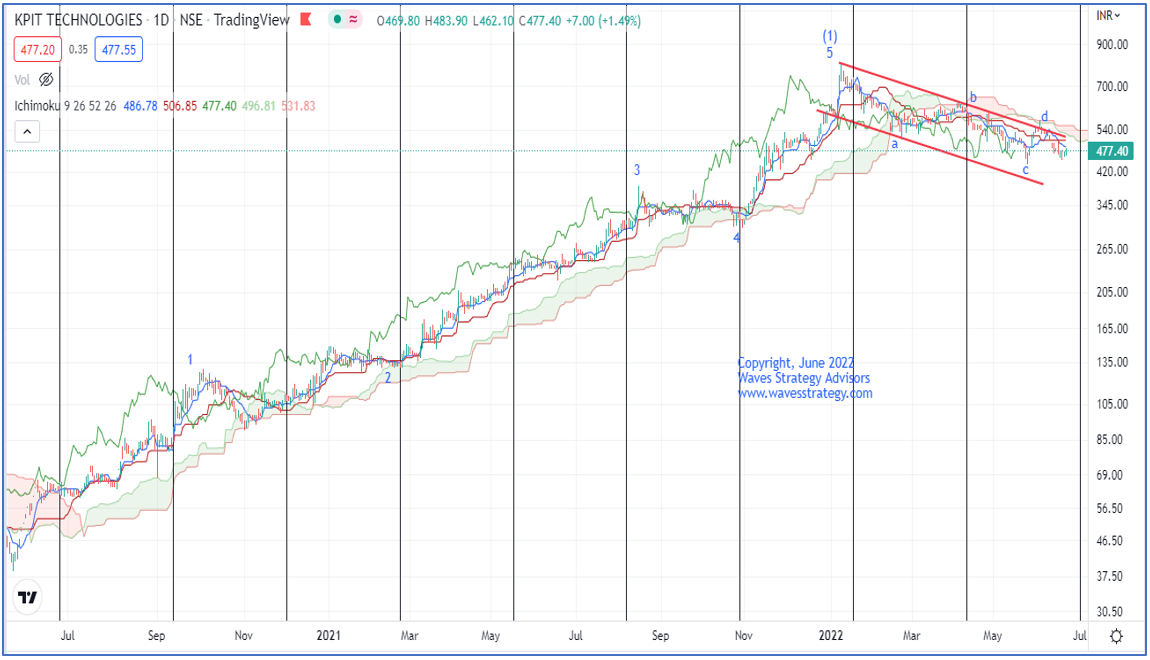
Wave Analysis:
Time Cycle: In the above chart the black line we have shown is 56 Days’ Time Cycle which is working extremely well since June 2020. Prices bounced back sharply from there and the next day continued to move higher. After completing of wave (1) we saw that prices failed to move above the cycle low and continued to drift lower. This suggests that cycle has turned into sell side.
Elliott wave: We can see that prices after forming a low near 70 is rallying on the upside in the form of Impulse fashion. Intermediate Wave (1) was completed near the highs of 700 levels and later continued to move lower in a corrective fashion in form of wave (2). Now within wave (2), prices are moving in the form of wave e which is overlapping in nature. Post completion of wave e we can see a leg up again in form of wave f.
Ichimoku cloud: In the uptrend from the lows formed on June 2020 prices have respected the Cloud. The cloud tends to provide support and reversed on the upside. However, after forming the high near 700 levels, prices moved lower towards the Ichimoku cloud and it started to act as resistance to the price.
In a nutshell, near-term trend for KPITTECH is negative with important resistance near 520 levels. A positive reversal back above 505 will suggest wave e is probably over and wave f higher is starting. This way one can trade in the combination of Elliott wave, Time Cycle, and Ichimoku Cloud and can ride the trend.
Master of Cycles – Learn the science of Trading using Hurst’s Time cycles, Gann square of 9 and forecast prices using Time. Time can be the missing element in your trade setup that can drastically change the way you trade, Limited seats only, Early Bird Ends soon – know more here
Mentorship on Timing the Markets – 3 months of complete handholding, access to private telegram group, Live trading session, Stock selection for Multibagger stocks and much more. Lifetime access to Gurukul, flagship training events and much more, Fill below form for more details: