Nifty Elliott wave, Volume profile and OI profile: Bulls Bears Tug of War!
Apr 27, 2022
Like this Article? Share it with your friends!
Nifty had a Gap down opening but is managing to hang around 17k levels in today’s session.
We can see sharp rise in Open Interest by both Call and Put sellers at 17k suggesting that there is short straddle into play for now and neither the Bulls nor the Bears are giving up.
Nifty hourly chart:
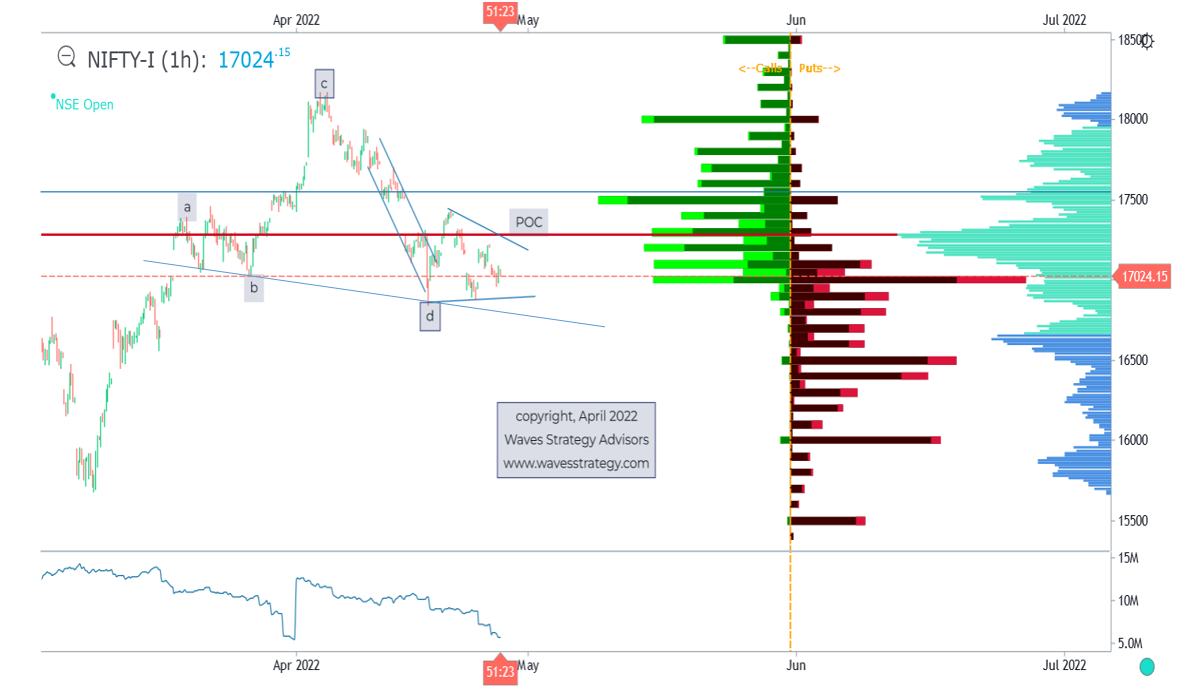
Point of Control – Volume POC is highest near 17280 levels followed by 16660 levels on downside. It seems that 17k psychological level will lose its importance soon. This level is also near the neckline of Head & Shoulder pattern shown on the above chart.
Elliott wave – Given the Gap down again today there is a possibility that wave e itself is forming a triangle pattern and is trapping both the Bulls and Bears on either side. It is best to sell options of faraway strike prices of next week in order to avoid getting whipsawed in the current move and at the same time make most from the sideways action.
In a nutshell, as long as 16660 is intact on downside and 17280 is protected on upside prices can continue to move in non-trending fashion.
Thus combining Options with Elliott wave and Volume profile, OI profile can provide clear understanding or conviction about the direction of market and one can then form strategies in Options accordingly.
Get access to daily equity research reports and see the application of above methods by yourself in “The Financial Waves short term update” published daily with Nifty, Bank Nifty, stocks and much more. Get access here
Learn the science of Trading using Elliott wave, Neo wave along with Ichimoku Cloud and Time cycles in the upcoming Master of Waves session. You can forecast markets right from short term to long term for Intraday trading, Swing and Positional trading. Know more here