Nifty Neo wave Diametric pattern, Why Crash if 17340 Broken?
Aug 25, 2022
Like this Article? Share it with your friends!
Neo wave is advanced Elliott wave concept which is GPS of the market. It gives maturity of trend, directional move possible and much more information a trader needs.
Diametric pattern is a 7 legged structure that has a typical behavior of contraction then expansion or vice versa. This is the most common pattern and can help traders take positions once the pattern is recognized early on.
Nifty hourly chart:
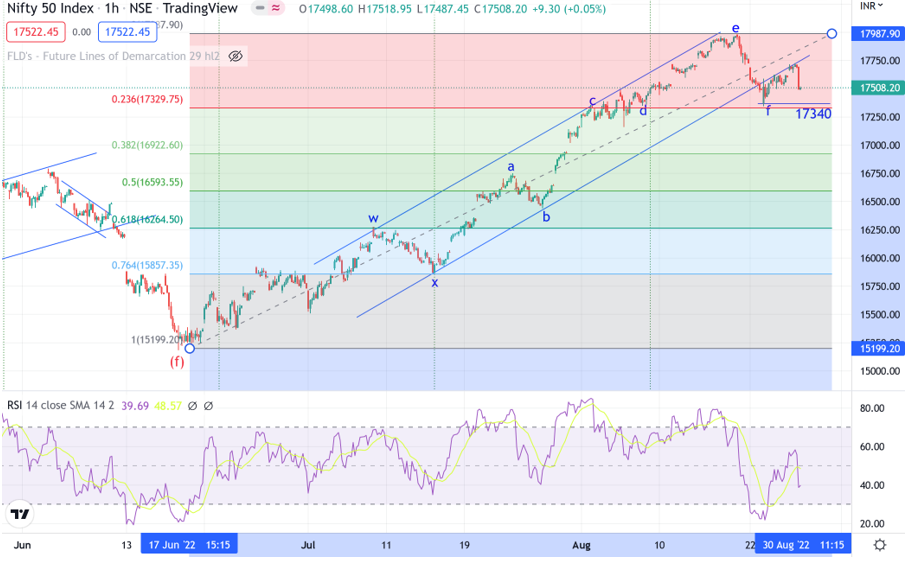
Nifty hourly chart shown above clearly shows the entire rise inform of Neo wave Diametric pattern from the lows of 15900 levels.
We have been able to catch the top at 18000 when everyone was super bullish and expected 2 to 3 days of fall. This was brilliant opportunity for Option traders to either buy puts or short calls to trade the reversal. Nifty in just two days declined from 17990 to below 17350 levels.
Neo wave clearly suggested that wave f should move on downside and also prices to move from upper trendline resistance.
Now near the lows of 17350 we had a positive Time cycle turning up on a 15 minutes time frame and so we alerted it is time for wave f completion and possible start of wave g higher. However, wave g trading is always tricky as this is the last leg within the Diametric pattern. Having said that we usually expect wave g to tend towards 61.8% to equality of wave a. But this is a guideline and not a necessity. So, now move above 17756 which is Gann sq of 9 level will extend the up move in form of wave g whereas break below 17340 might indicate a deeper fall and complete the entire rise.
Where many are looking at macro data or inflation and Crude oil for buying or selling markets we are simply looking at prices alone with Elliott wave lens to understand the areas of reversal and taking a trade setup as per wave patterns.
Fibonacci retracement gives target of 16250 which is 61.8% of the rise but only once we see sharp fall below 17340 levels followed by wave g completion.
In a nutshell, move above 17756 is required to extend wave g upside whereas breach below 17340 will be bearish for deeper correction. One can trade basis of these levels once the pattern completion is confirmed using two stage confirmation technique.
Thus one can know the levels when to turn bullish or bearish and trade prudently.
Master of Waves – Learn the science of Trading Using Elliott wave, Neo wave and Time cycles on 17th – 18th September 2022. Empower yourself using the method that very few are aware of which is simple step by step process for trend forecasting. As we always say, once and Elliottician always an Elliottician and there is a reason to that. See it yourself, Limited seats only, Early Bird Ends on 31st August 2022. Know more