NIFTY 55-Day Time Cycle & the FLD (Hurst) — How to Time Swings and Trade with Confidence
Jun 15, 2026
Time cycle analysis proves that it is possible to time the market. Most traders grow up hearing the opposite — “Never try to time the market.”
But the study of cycles shows that markets move in rhythmic patterns, and when these patterns are measured scientifically, they offer powerful forecasting capabilities.
This research applies J.M. Hurst’s Time Cycle principles — originally developed by an aeronautical engineer who discovered cyclical rhythm even in stock market data — to the Indian markets and NIFTY. We extend Hurst’s methodology using the 55-day time cycle and FLD (Future Line of Demarcation) concept to understand how NIFTY has been responding to these cyclic forces.
Nifty daily chart with Time cycle and FLD
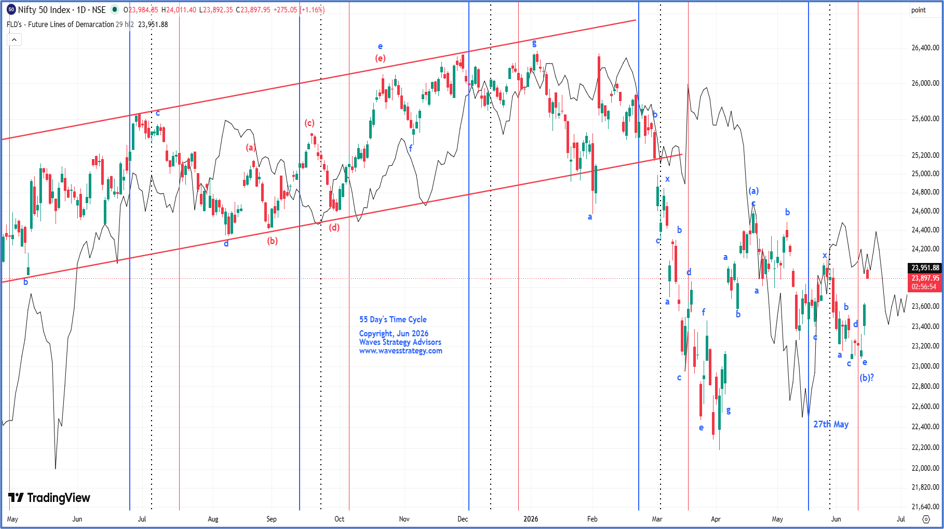
NIFTY Daily Chart: 55-Day Time Cycle and FLD
The accompanying NIFTY daily chart uses Hurst’s methodology to plot the 55-day dominant cycle. As seen on the chart, NIFTY has been following this 55-day rhythm remarkably well.
There are three vertical lines marking the time cycle zone:
- Blue line
- Dotted black midline
- Red line
Together, these form what we call the Cycle Zone.
Understanding the Cycle Midline
The dotted black midline represents the exact theoretical cycle point. But since time is a dynamic element and cycles are not perfectly rigid, we apply a 10% leeway. For a 55-day cycle, this translates to ±5 days on either side.
The most recent cycle was on 27th May 2026. However, timing alone is not sufficient — we also need price confirmation.
A close above the prior swing high near 24090 will be the first indication cycle turning on the buy side.
Role of the FLD (Future Line of Demarcation)
On the chart, the black line represents the FLD, an essential tool from Hurst’s model. The FLD is plotted based on the time cycle and serves as:
- Support
- Resistance
- A projection tool for targets
Current Market Position: Critical FLD Intersection
Nifty is trading close to the FLD line which can be seen in the above chart. A daily close above the FLD intersection can act as Bullish Confirmation.
- We will revisit the above scenario once there is a confirmation by break above 24150 levels.
In a nutshell, Time plays vital role for decision making ability for traders. The concept of time can be applied even on 15 minutes chart and 5 minutes chart that too on stocks. For Nifty, prices closed at important juncture with 24090-24150 crucial zone over next few days. Close above it will be strongly bullish. On the downside, 23620 important Gap support.
Kalchakra – Bracket Master of Cycles - 4th & 5th July 2026A rare and powerful training where you will learn:
- Time forecasting along with price targets
- Advanced time cycle techniques
- Integration with Gann Square of Nine
- Sacred market science used by few
Brahmastra Mentorship – Advanced Market Timing
Time the market to the very day, hour, and minute using a powerful combination of:
- Elliott Wave & NeoWave
- Hearst Time Cycle Analysis
- Stock Selection Algorithm
- Practical Risk & Money Management
Fill the form below to know more