Nifty 85 Weeks Cycle With Head and Shoulders Pattern
Dec 23, 2021
Like this Article? Share it with your friends!
We had used a multitude of advanced techniques to derive the target of 16700 last month in “The Financial Waves Monthly Update” research report. Check out the research we had published on 11th November itself.
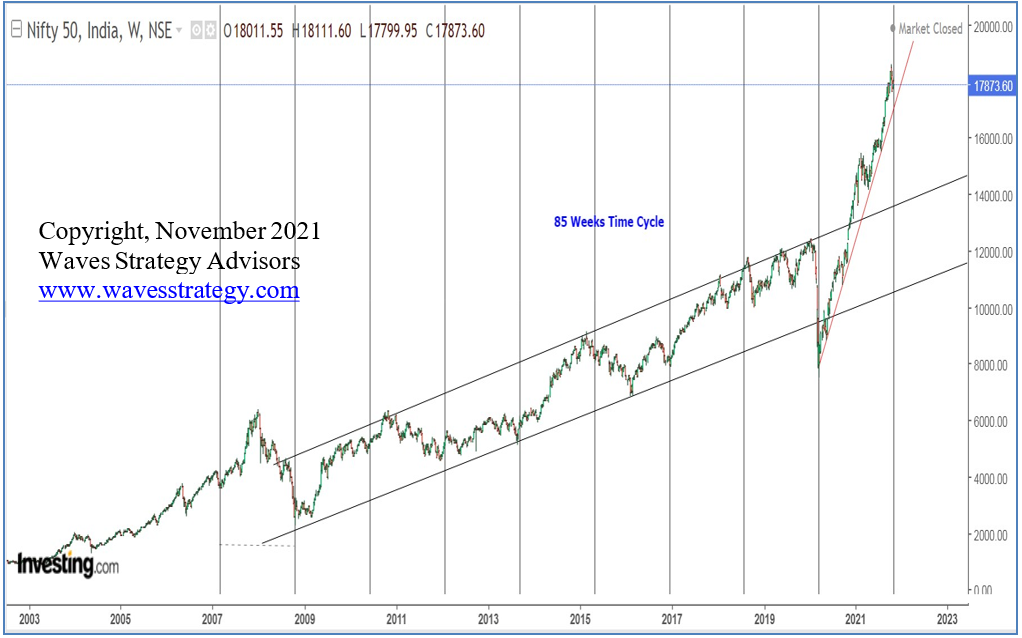
Nifty weekly chart with 85 Weeks’ Time Cycle:

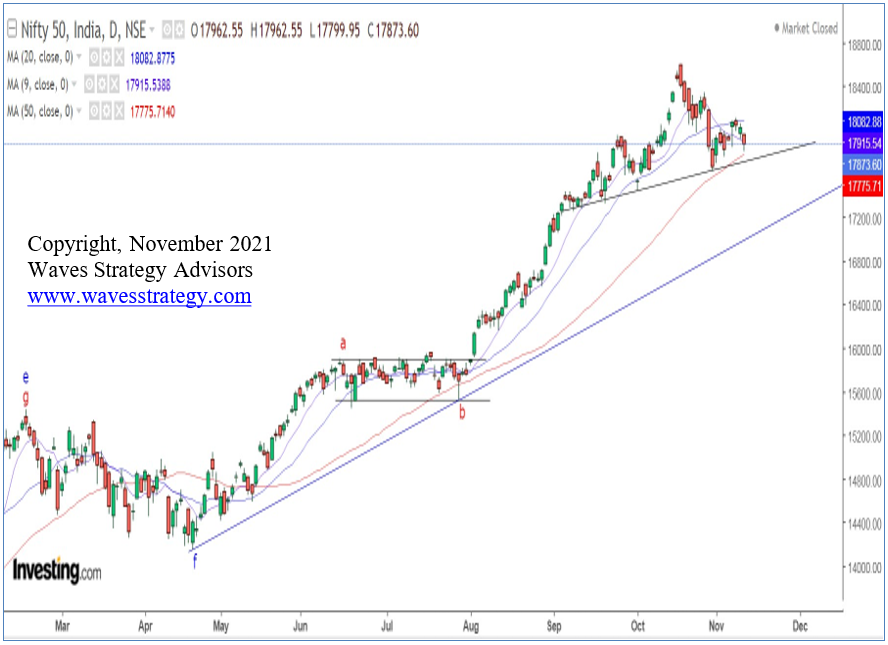
Nifty daily chart: (11th November 2021)

Nifty weekly chart with 85 weeks of Time Cycles. We have been following this time cycle from long time as it has formed important bottoms in the past. We can see that since the year of 2007, this cycle has formed crucial lows when it was due as shown by horizontal lines. The exception to this remains the year of 2015 and end of 2018 when this cycle acted as “Inversion”. The concept of Inversion suggest that instead of lows, the particular cycle forms tops.
Now the same cycle has become due and yet market is trading near to the highs and has not witnessed any decent correction till now. Hence probability of inversion can increase from hereon by which it can form crucial top instead of lows. However, along with use of time cycles, price confirmation is must. It is only on weekly close below 17452 level that will suggest that inversion has started playing its course here. One should always give 10% (+-) to the concept of time cycles while deriving important lows or tops.
Nifty daily chart with different simple moving averages. Prices broke below the 20 periods SMA (simple moving average) for the first time since the breakout witnessed near 16000 level in August 2021. This is providing the early indication that we might witness consolidation and corrective phase in coming times. At the same time, 9 periods of SMA has given crossover below 20 periods SMA for the first time since August 2021. Now further breach of 50 periods SMA will provide more confirmation that near term trend is reversing on downside.
Also there is a possibility of formation of ‘Head and Shoulders Pattern’ as per which right shoulder is under process. This possibility will remain open as long as 18350is not taken out. Close below 17610 will decisively break the neckline of the pattern and then conservative target can be expected at 17064 followed by 16700 level where 50% and 61.8% retracement of the prior rise from 15513 to 18604 level is placed.
In short, the month of October 2021 was quite disappointing from the perspective of bulls as it failed to close the month at the high end and moved lower towards 17613 levels. Post that prices have continued to trade in the short-term range and now breakout is awaited. Looking at the channeling technique, Neo wave perspective, RSI, Bollinger bands and moving averages, there is high probability that prices may enter into corrective phase from hereon.
This possibility will remain intact as long as 18350 is not taken out. At the same time, any move below 17610 followed by 17450 will suggest that near term trend has reversed on downside and retracement towards 17064 followed by 16700 level can be expected. On the other side, any weekly close above 18350 level will suggest still more steam is left in this uptrend!
Happened:
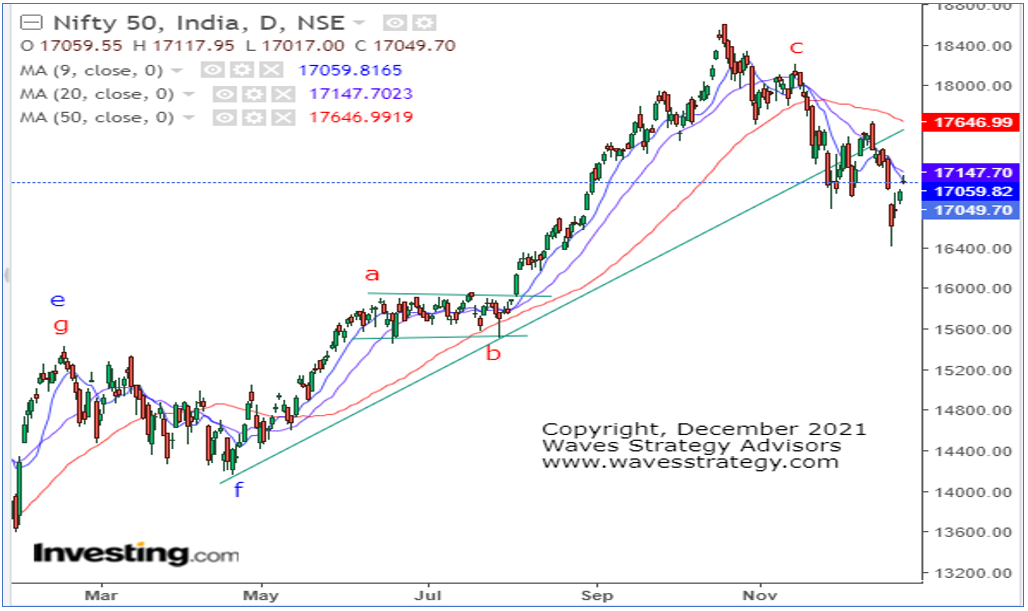
Nifty daily chart: (23rd December 2021)

Nifty moved down precisely as expected and moved even below the mention target of 16700 levels. The index formed a low near 16410 levels on 20th December which was a move of 1200 points from the break out level of 17610. All this was forecasted more than a month ago!
From the above case study, we can clearly see how multiple methods used together with Neo waves can be used to capture large moves in the index and provide for early entries for great risk reward trade setups.
Festive Special Offer - Get access to the Monthly research consisting applications on charts and how you can ride the trend using simple powerful Wave theory, Act NOW! Subscribe here
Master of Waves – Learn complete Elliott wave, Neo wave along with Time Cycles and equip with excellent trade setups for trading Intraday and positional along with forecasting the markets from very hour, day and months. 2 Days of Live event on 15th – 16th January 2022, Early Bird ends on 25th December, Know more here
