Nifty – Accurately Trading the Chaos using Waves
Mar 16, 2020Nifty had been trading very accurately and is repeating what we saw in 2008! We have been telling our readers to be prepared over past two weeks and it has simply moved in amazing fashion.
These are unprecedented times and the only thing that can help you take the trades is on basis of charts and Elliott wave / Neo wave patterns
You can follow us on the YouTube channel @kyalashish and watch the latest webinar that mentions one simple method to trade in this market. See it over here
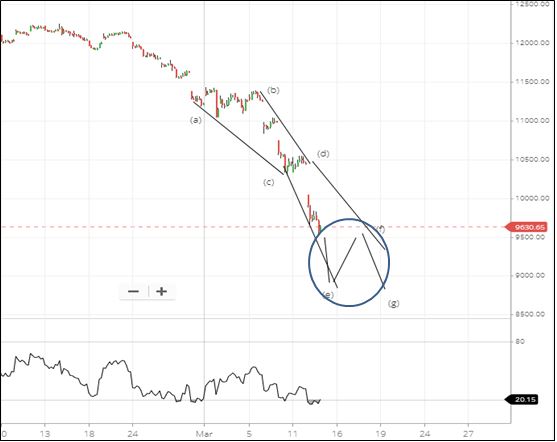
Now look at the below chart of Nifty in which we showed the path Nifty can follow in the daily morning research report:
Nifty hourly chart (Anticipated on 13th March)
Nifty hourly chart: Happened so far
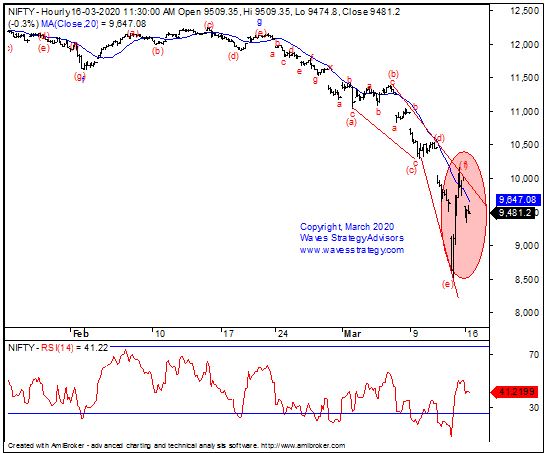
Wave analysis: Following was mentioned on 16th March morning research report.
In the previous update we mentioned that “Nifty experienced the biggest single day fall in absolute terms. Trend continues to be firmly negative and the next support is near 8900 – 9100 levels” Nifty had a huge collapse and moved below 8900 levels and recovered back equally fast creating wild gyrations in shortest possible time.
On 13th March Nifty opened with a huge gap down of 480 points and immediately sold off and in the first 10 minutes hit the lower circuit at 8555. Trading was halted till 10:20 and as the circuit opened, the index shot to the upside to fill the gap and recovered the entire day’s loss and managed to close in green with a gain of 3.8%. The move on upside was so fast and quick that it took only a tick for index to gain more than 700 points as soon as the circuit was opened. We witnessed the repeat of 2008 and I have pointed out enough number of times in past two weeks that we are seeing unprecedented move not witnessed over a decade. A few who paid attention to this might have made the most of this trend in shortest possible time….
Happened: We showed the probable path on 13th morning research report the day of circuit down and sharp recovery. If you look at the path shown on that day’s morning research prices have behaved in similar fashion. The magnitude of move was much more but the correlation or the trend identification was perfect. Compare the first chart with the second and you will know. A smart trader can make a killing if he or she is aware of the overall trend direction. Are you among those 5% of traders who are able to capitalize on the ongoing Elliott wave pattern?
The path shown in first chart is based on a pattern from advanced Elliott wave – Neo wave and the second chart shows how precisely prices have behaved. For trading successfully you need an edge and above is enough proof how well you can trade the chaos and ride the trend!
I have explained about Nifty trade setup and stocks on CNBC TV18, watch my latest interview over here
Learn yourself how to trade the ongoing market using basic but powerful trade setup. In the upcoming training on Master of Technical Analysis (MOTA) you will see 5 simple Trade Setups to trade the market. This is an online session scheduled on 21st – 22nd March 2020. Only a few seats left, Contact US here or WhatsApp +91 9920422202 to register.