Nifty Analysis Using Open Interest, Volume Profile & NeoWave | Key Levels 2026
Apr 06, 2026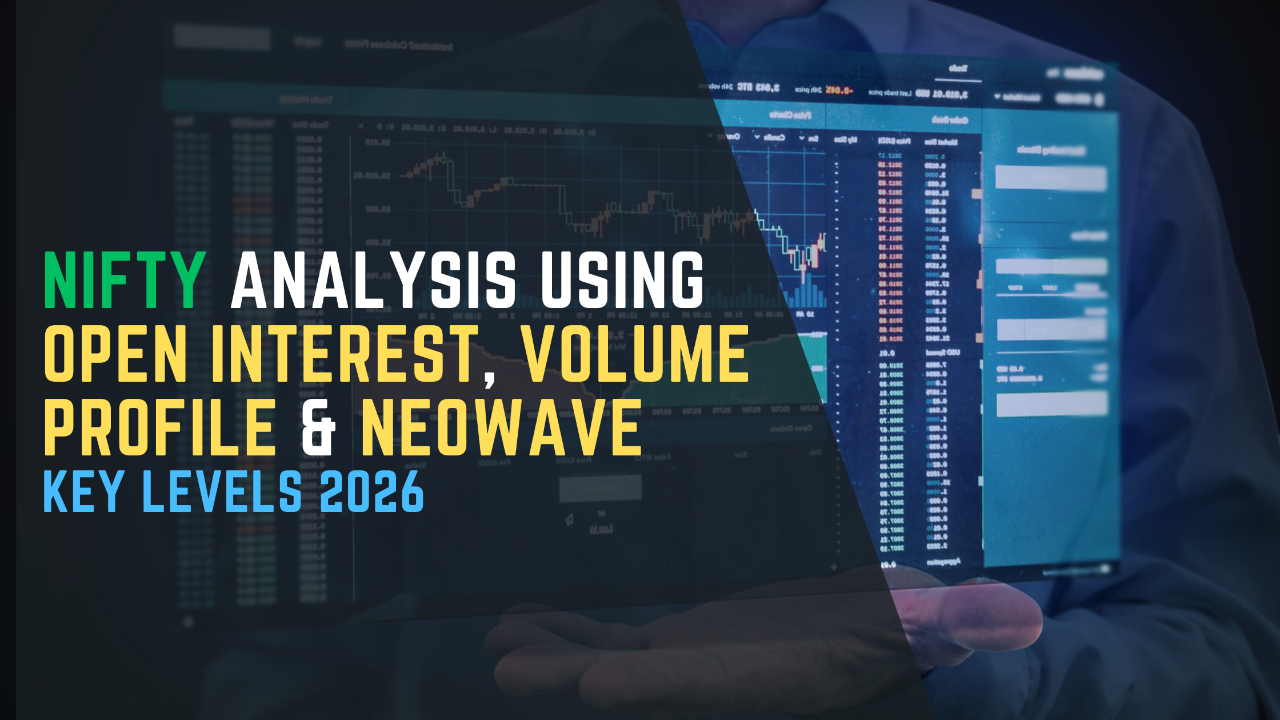
Nifty’s Waterfall Decline: Structure Hidden Within Chaos
Nifty has been witnessing a waterfall-style decline, clearly visible on the hourly charts. Prices are moving sharply downward in the form of gap-based declines, while the pullbacks on the upside have been equally fast.
What stands out, however, is not just the speed but the symmetry.
Each leg of the fall appears almost equal in magnitude, including the most recent decline toward the 22,180 zone a level that was already highlighted in our monthly research report Akash.
This is where structure begins to emerge from apparent randomness.
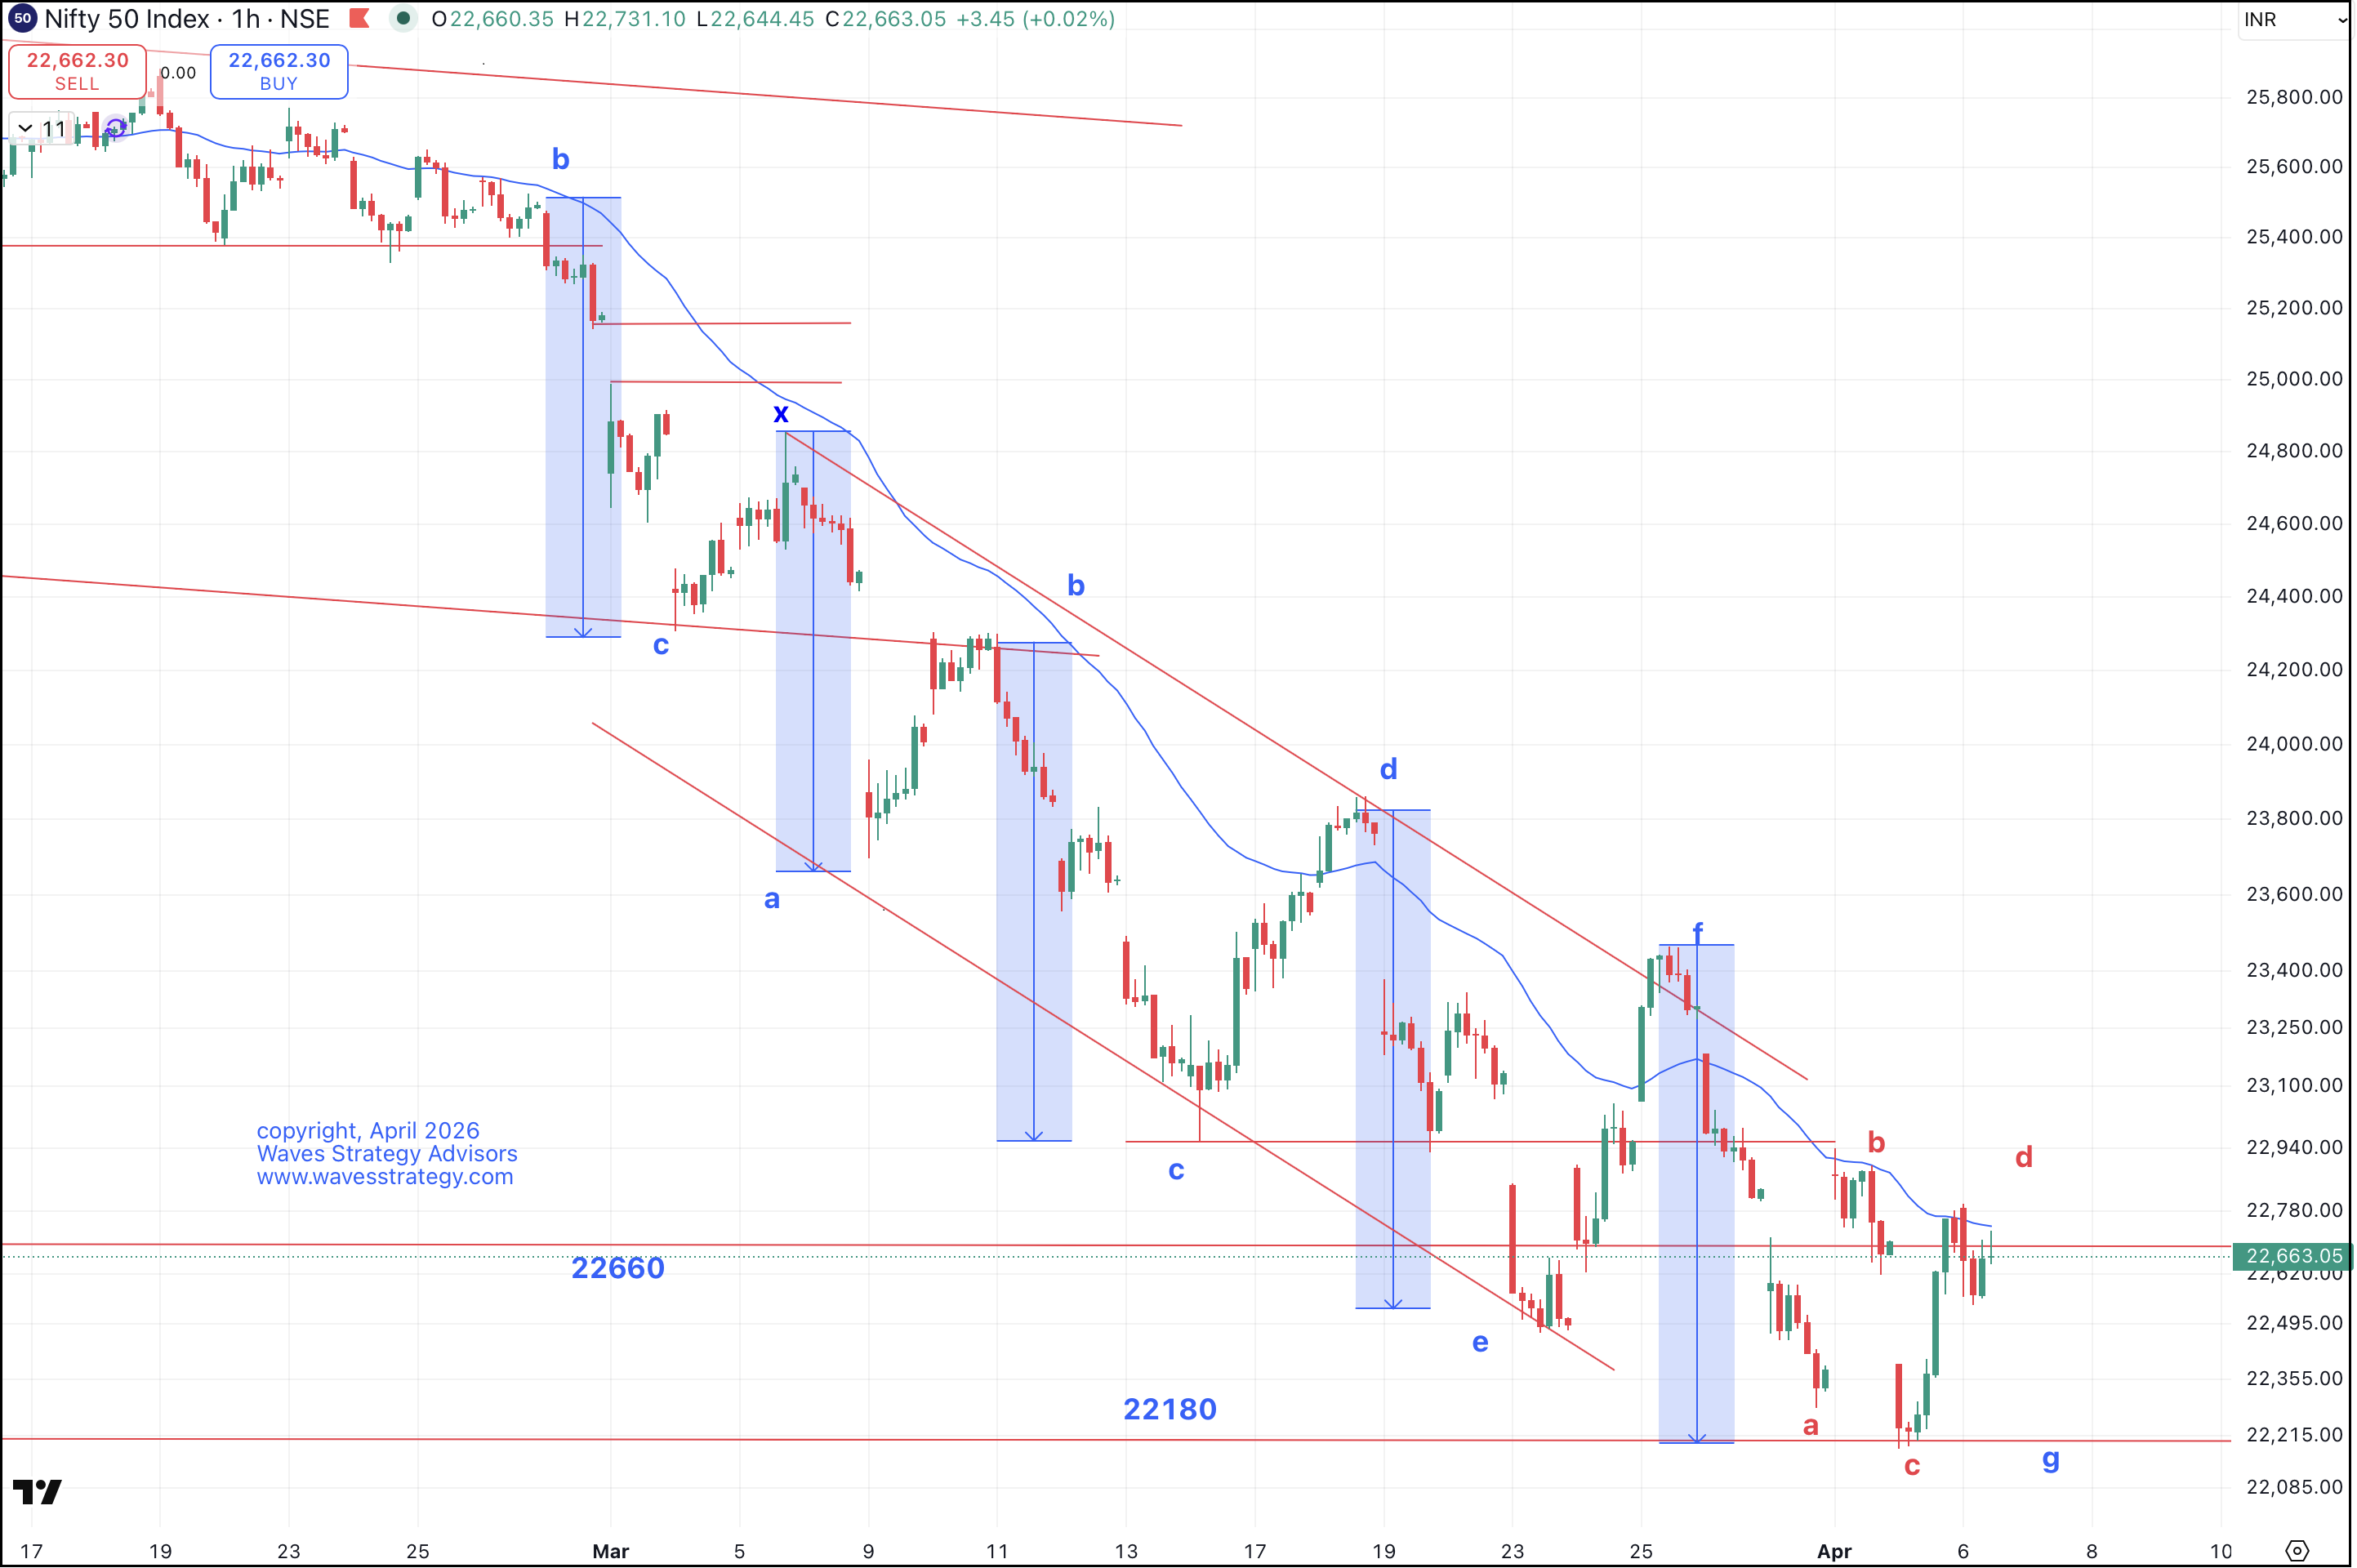
Nifty Hourly Chart with Price Action
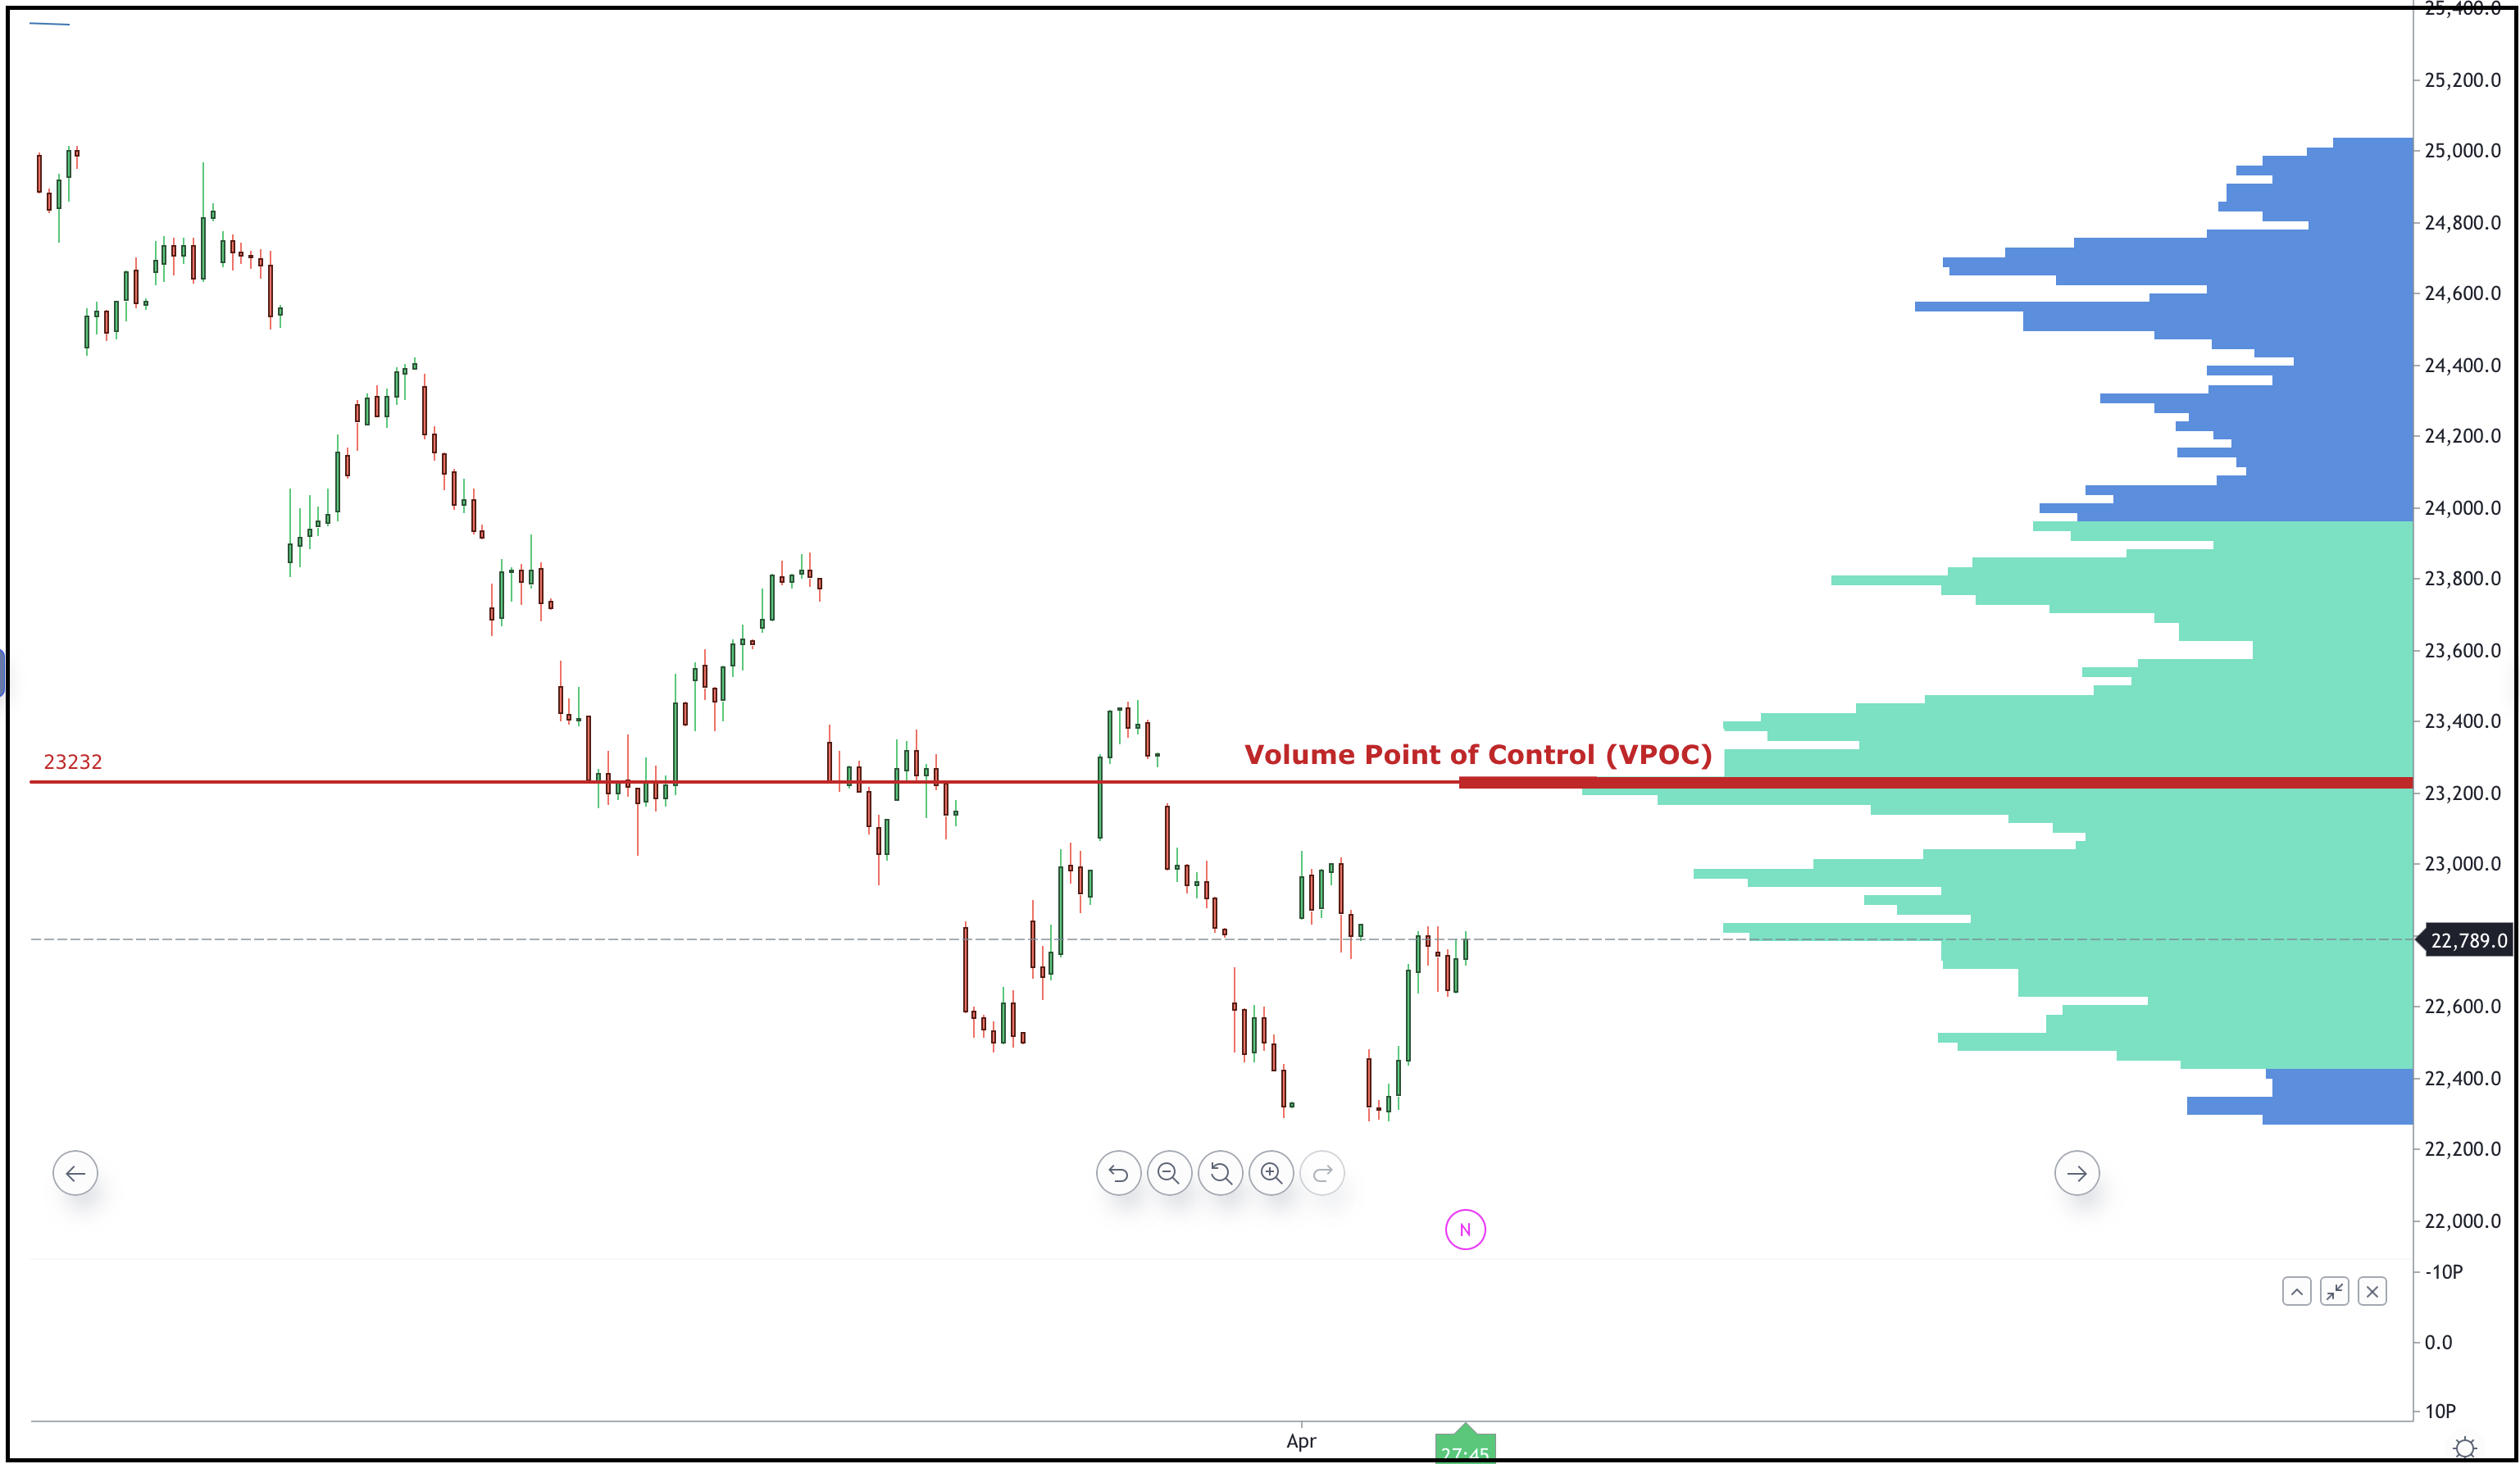
Nifty Hourly Chart with Volume profile
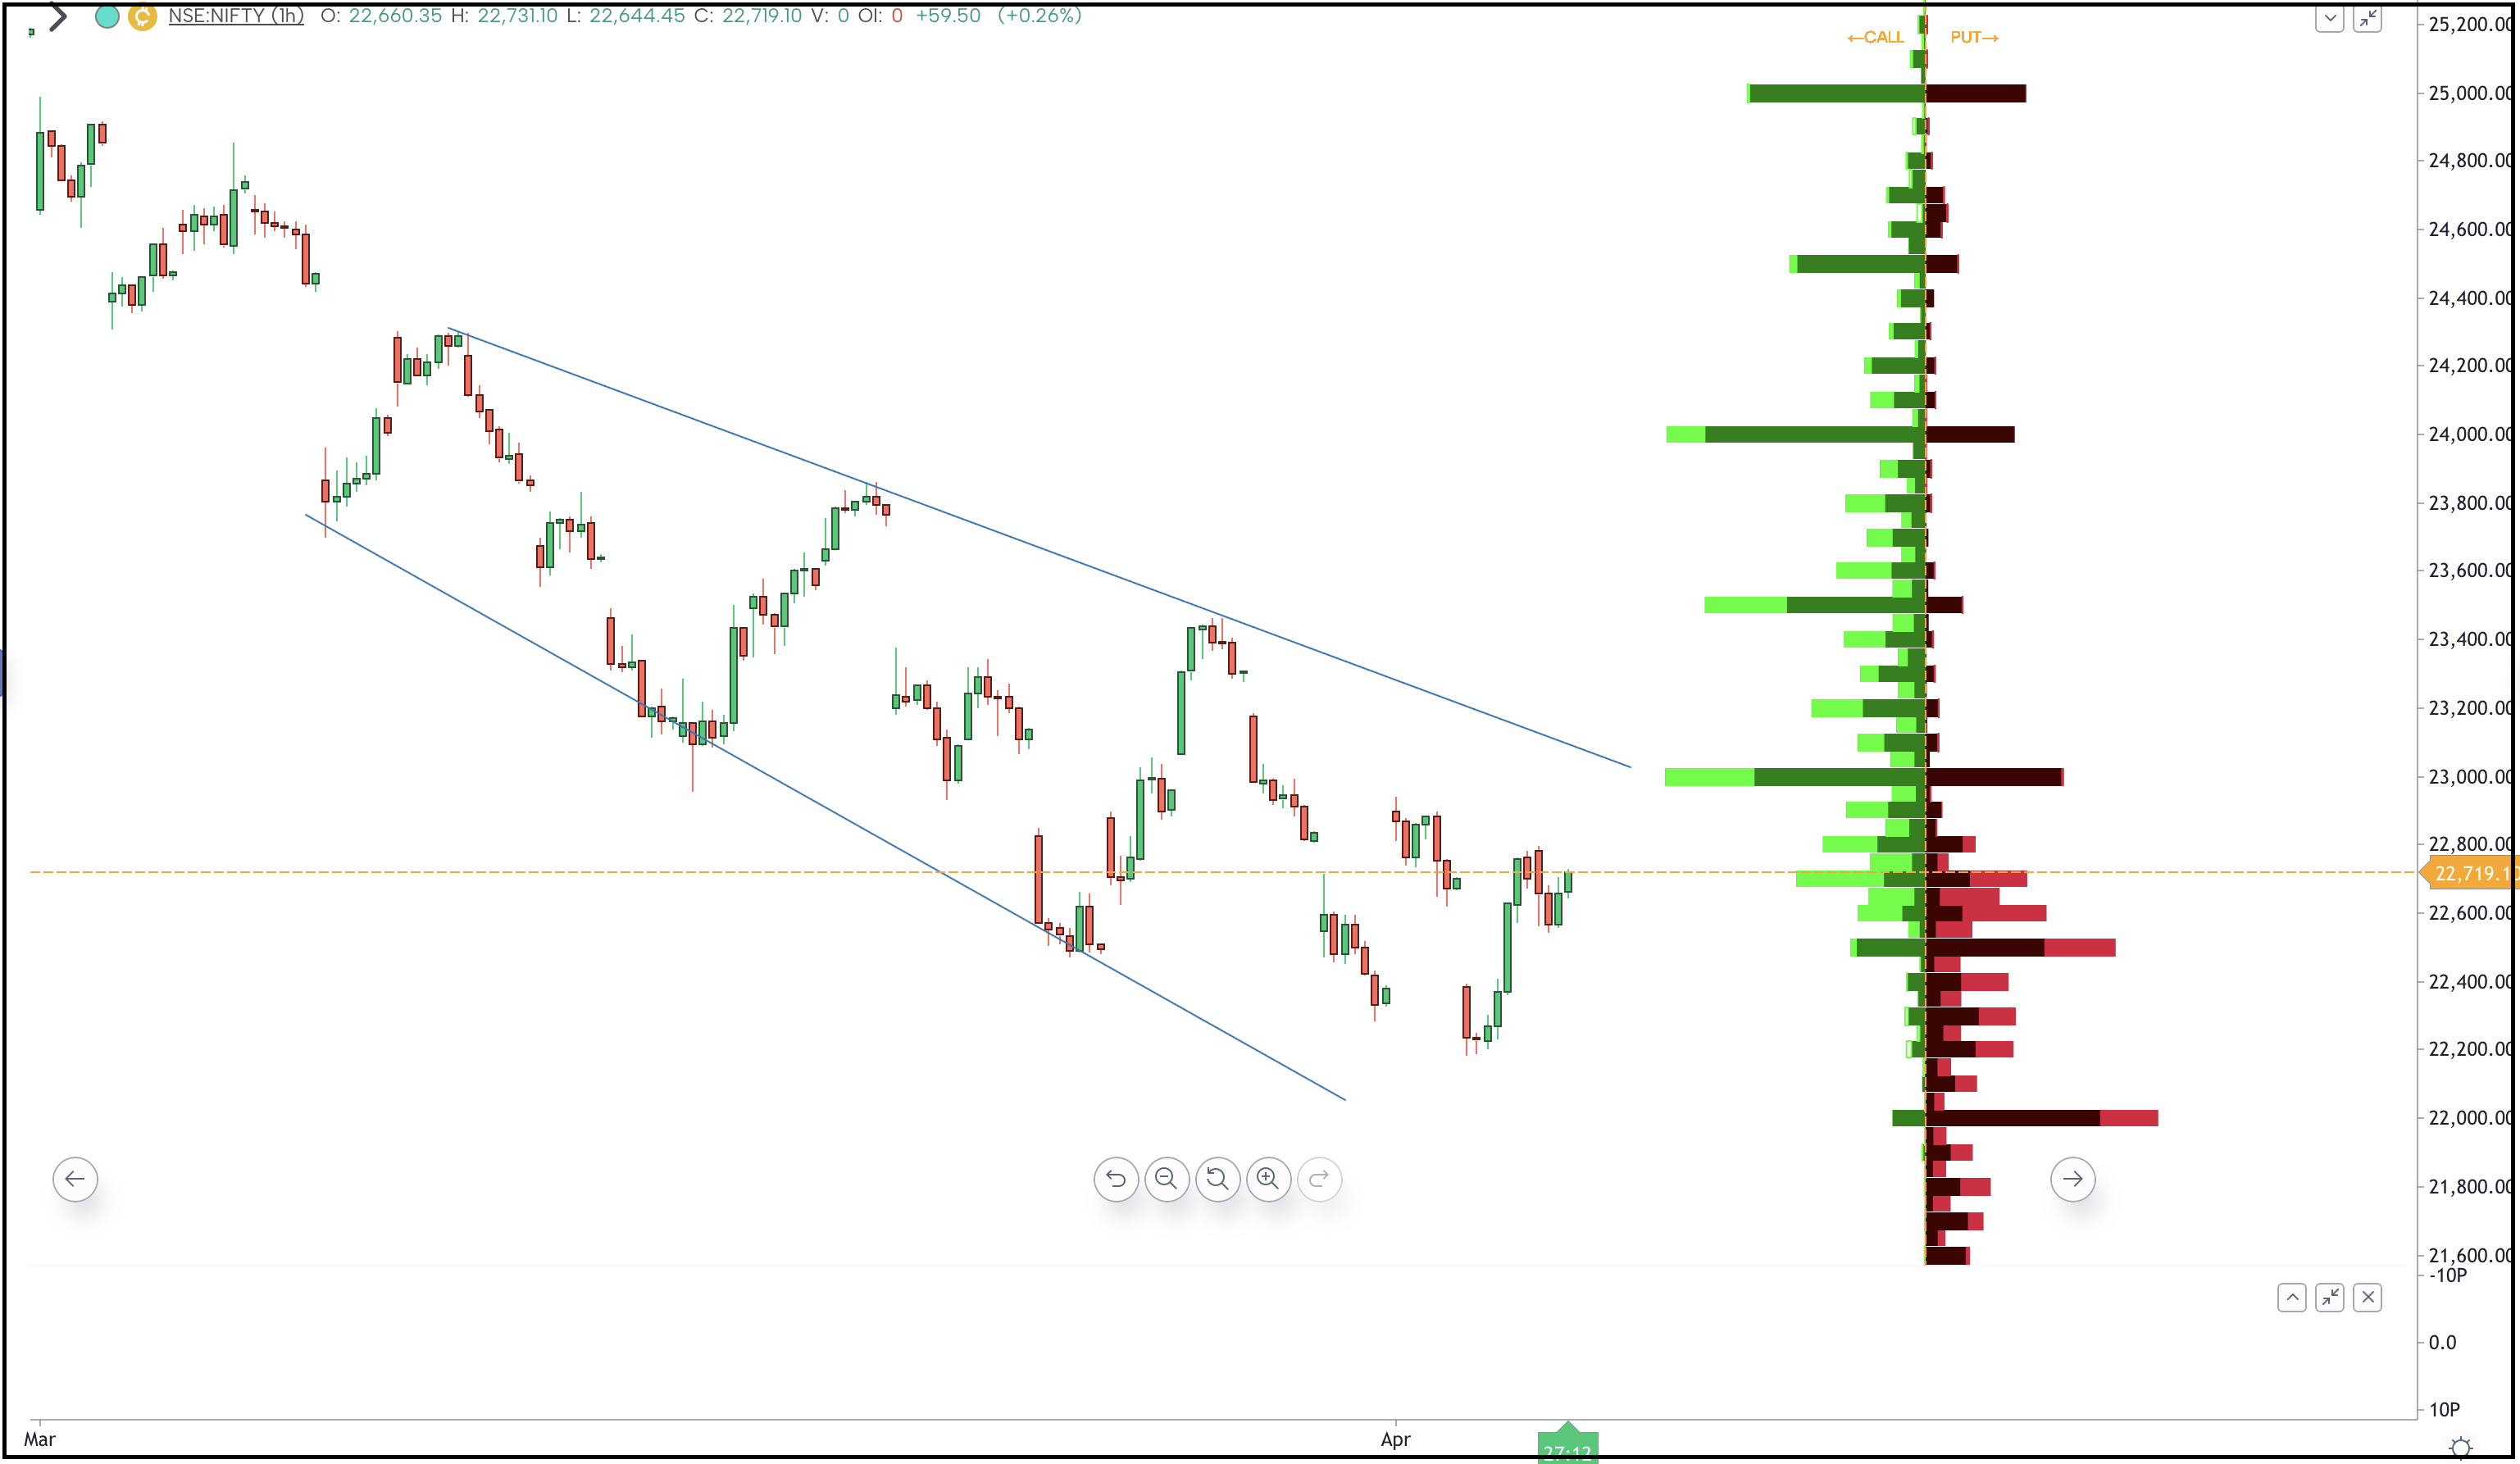
Nifty Hourly Chart with OI Data
NeoWave Perspective: Double Corrective Pattern with Wave g in Progress
From an advanced Elliott Wave (NeoWave) perspective, the entire decline appears to be unfolding as a double corrective structure, with wave G currently in progress.
- Wave G is forming a triangle pattern
- A double bottom is visible near 22,180
- Positive divergence is observed on the KST indicator
This combination is not random—it reflects exhaustion of downside momentum.
Key Interpretation
- 22480 followed by 22,180 → Critical structural support
- Sustaining above this level suggests downside exhaustion
Probability shifts toward an upside breakout.
Breakout Confirmation Levels to Watch
For confirmation of bullish intent, the following levels become crucial:
- 22,930 → Initial breakout trigger
- 23,040 → Strong confirmation level
A decisive move above these levels can shift market structure from corrective to impulsive.
Open Interest Profile: The Tug of War
The Open Interest (OI) data reveals a classic battlefield:
- 23,000 Call OI → Heavy build-up (resistance zone)
- 22,500 Put OI → Strong support positioning
This creates a tight range of control between buyers and sellers.
Critical Insight
If Nifty manages to break above 23,040, it can trigger:
- Call seller panic
- Short covering rally
- Sharp upside acceleration
On the downside:
- 22,480–22,500 zone is expected to remain well defended
Volume Profile: Where Smart Money Acted
Volume Profile provides deeper clarity into institutional activity.
- Highest Volume Node (POC): ~23,200 (Futures)
- Equivalent Spot Level: ~23,100
This indicates:
- Maximum participation by large players
- A zone of high acceptance and strong resistance
What This Means
- Nifty is likely to face stiff resistance between 23,040–23,100
- A breakout above this zone can unlock aggressive short covering
Strategy Insight: Combining Forecasting with Price Action
When NeoWave (forecasting) is combined with:
- Open Interest Profile
- Volume Profile
- Momentum tools (KST)
…it creates a high-probability decision framework.
Suggested Approach
- Bull Call Spread Strategy
- Enter near confirmation levels
- Maintain strict stop-loss discipline
This is not about prediction—it’s about systematic trading.
The Real Edge: Confluence of Tools
Individually, each tool provides partial clarity.
But together:
- Wave Structure → Direction
- OI Data → Positioning
- Volume Profile → Institutional Zones
This combination becomes a lethal edge for serious traders.
Brahmastra: Go Beyond Price – Learn Time Cycles
Brahmastra is a 3-month intensive journey focused on:
- Time Cycle Analysis
- Combining Time + Elliott Wave
- Precision in identifying turning points to the day
Includes
- Tradership sessions
- Full access to Trishul Program
- Structured trader development approach
This program is built on a powerful belief:
Markets can be timed—not just analyzed.
👉 For more details, click here.
Trishul Program: Master the Three Pillars of Market Understanding
Trishul is designed as a structured learning pathway combining three powerful frameworks:
- Options Mantra (11th–12th April)
- Elliott Wave (Foundation to Advanced)
- NeoWave (Advanced Forecasting tool & Precision)
What You Learn
- Event-driven options strategies
- Expiry-day income frameworks
- Risk-reward based trade construction
- Tools like Keltner Channels & KST
- Practical stop-loss & execution discipline
This is not theory—it is applied market understanding.
👉 Limited seats only. Fill the form below to apply.
Final Thought
Markets may appear chaotic, but structure always exists beneath the surface.
When forecasting tools (NeoWave) align with real-time data (OI & Volume), you stop reacting—and start anticipating.
That shift is where real trading edge begins.