Nifty and Bank Nifty Long-Term Forecast Using Elliott Wave Neo Wave and Time Cycle Analysis
Jan 14, 2026
Advanced Market Forecasting Through New Wave Theory, Time Cycles, and Ratio Analysis
This article presents a structured nifty-and-banknifty-analysis-using-elliott-wave-neo-wave-and-time-cycle, focusing on long-term market structure, wave behavior, relative performance, and time-based market cycles. The objective is to assess trend sustainability and potential future movement using technical frameworks rather than short-term speculation.
Nifty Monthly Chart: Long-Term Structural Trend Remains Intact
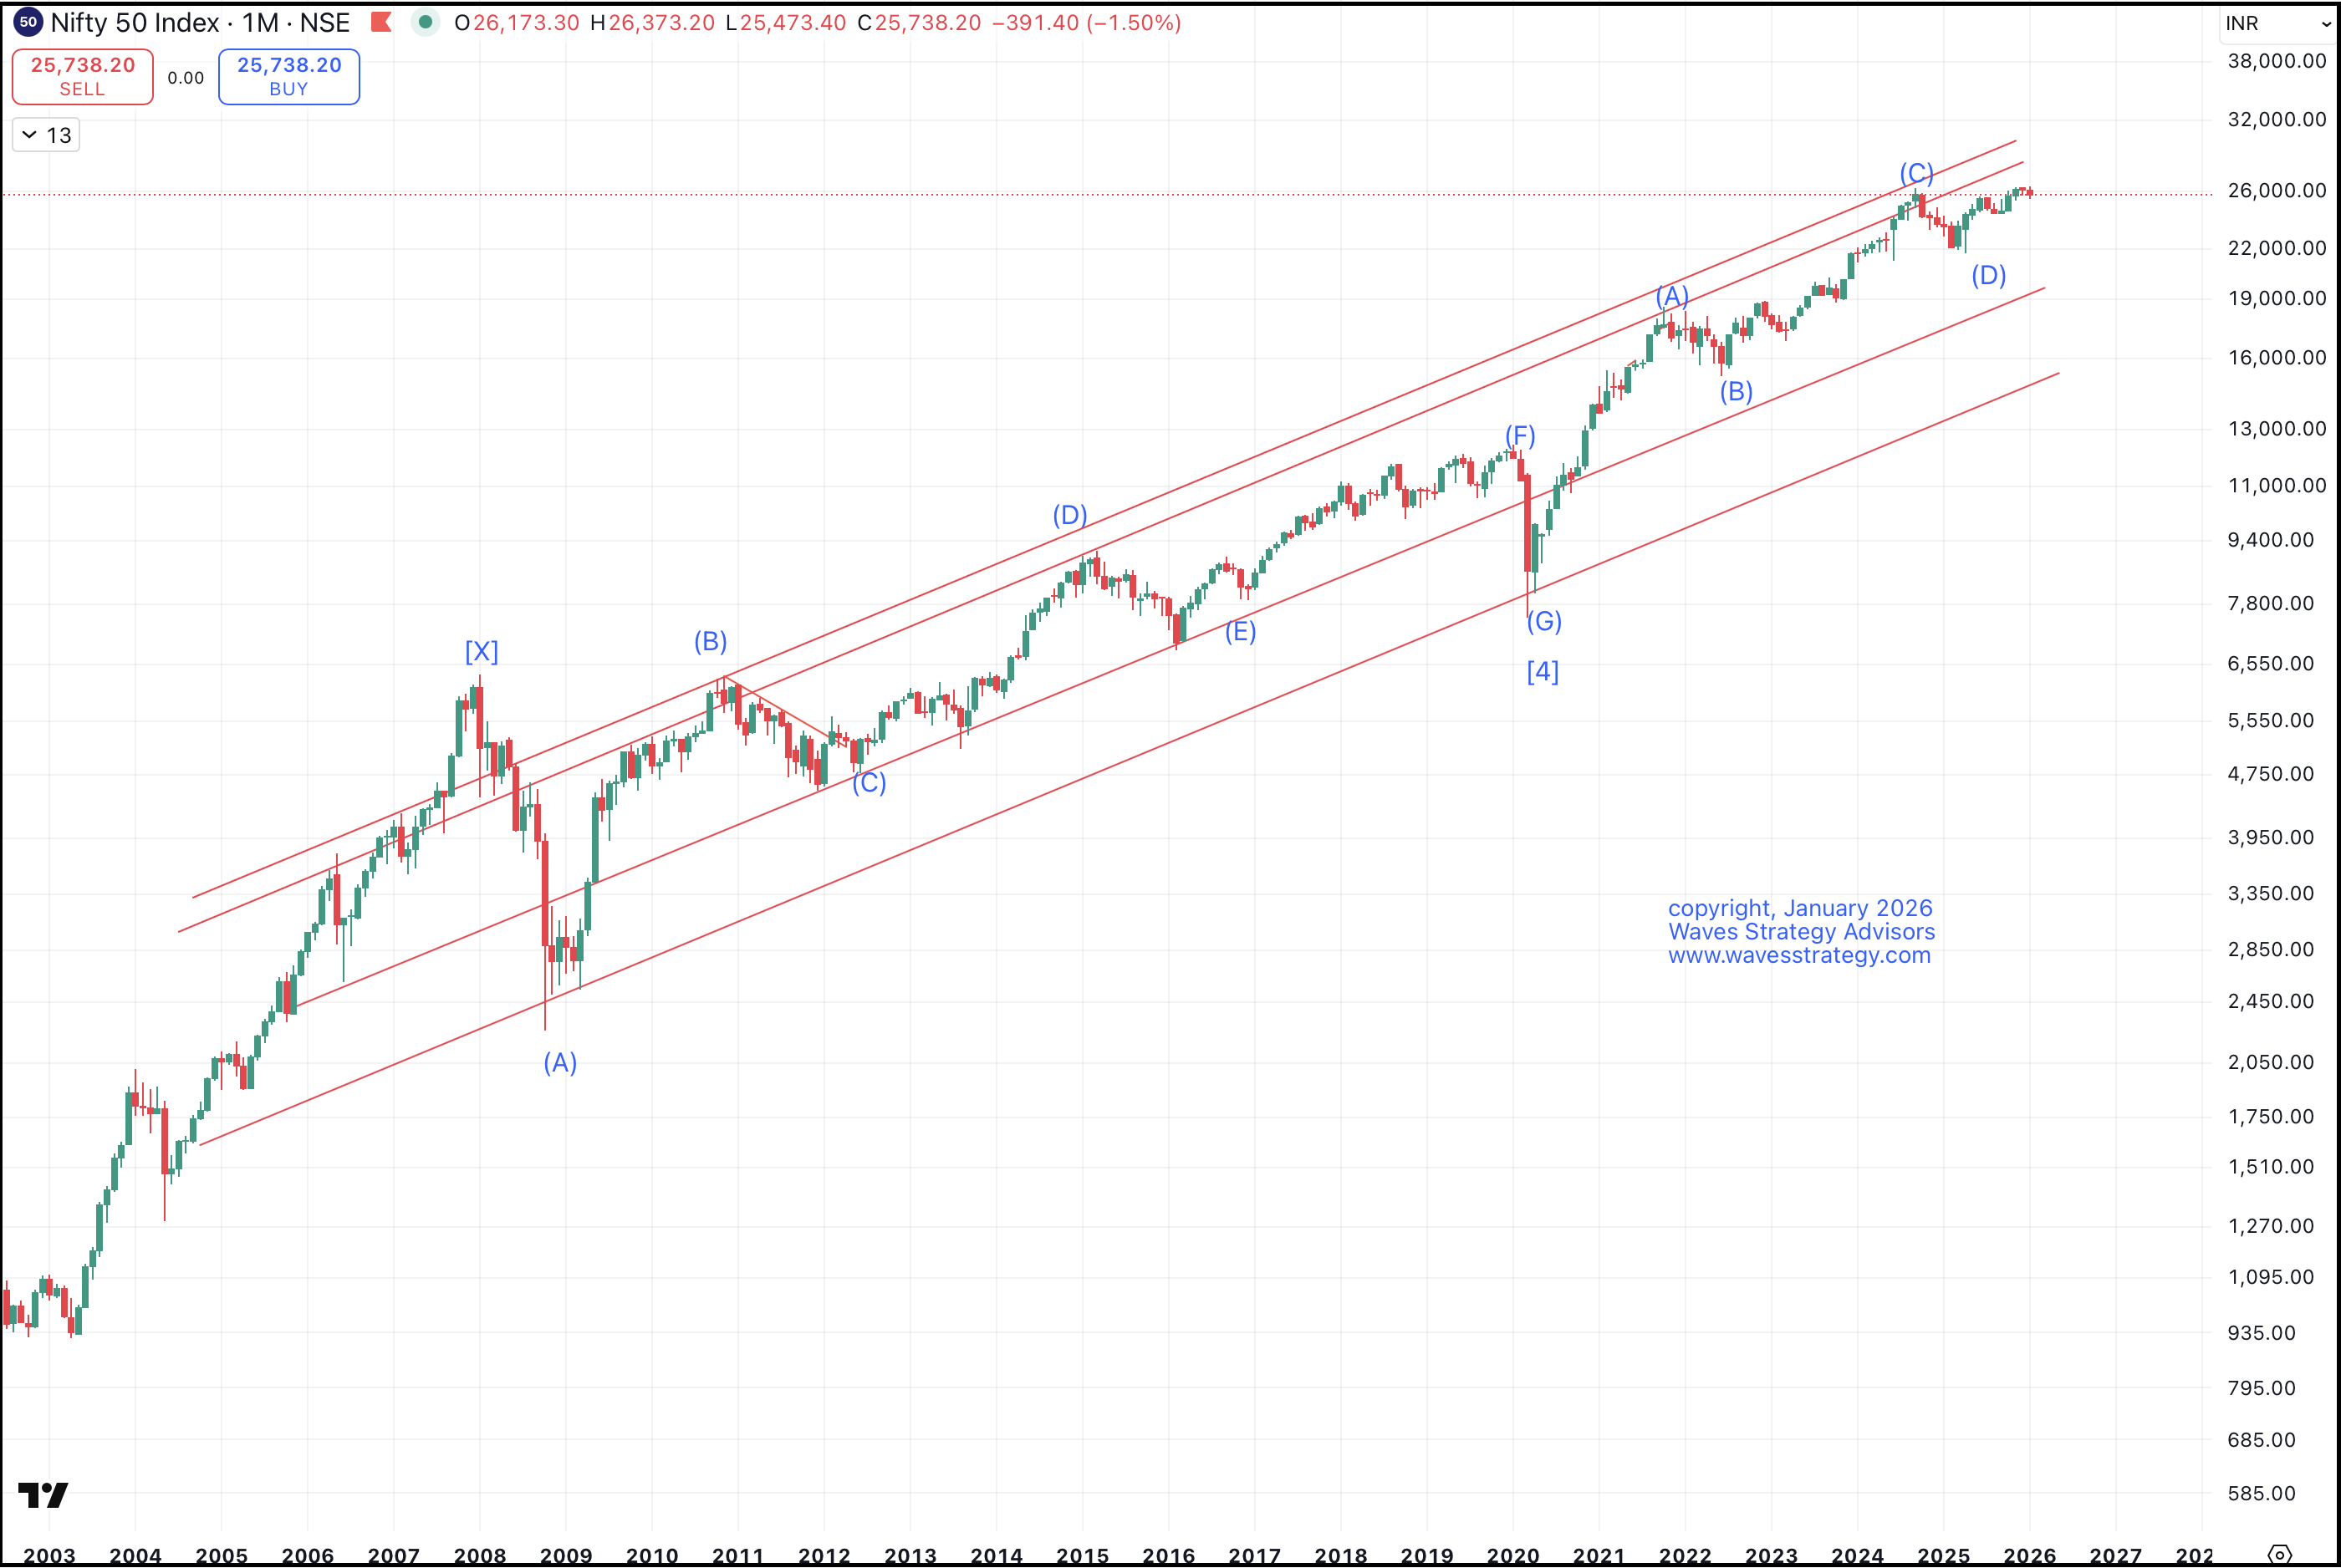 From a medium- to long-term perspective, Nifty continues to move within a clearly defined rising channel on the monthly timeframe. Price action has consistently respected both the upper and lower boundaries of this channel, confirming the presence of a long-term upward structure.
The major declines during 2008 and the 2020 COVID period tested the lower boundary of this channel. In both cases, the broader structure remained intact, indicating corrective phases rather than a breakdown of the long-term trend.
Following the COVID low, Nifty completed a Cycle Degree Wave 4 and subsequently began progressing higher in a Diametric structure, as defined under Neo Wave theory.
Cycle Degree Wave Count: Ongoing Wave 5 with Corrective Internals
At present, the index is progressing through a Cycle Degree Wave 5, within which Primary Wave 1 is currently unfolding.
However, the internals of Primary Wave 1 are corrective in nature, as prices are forming a Terminal pattern. Terminal structures generally indicate corrective rises, even though they continue to trend upward.
Within this Diametric formation:
- Wave E is currently in progress
- Wave E typically mimics the behavior of Wave C
This implies that any short-term setback or volatility should be viewed as a long-term buying opportunity, since the broader structure still indicates multiple upside milestones yet to be achieved.
Bank Nifty Weekly Chart: Structural Behavior Since 2009
Bank Nifty Weekly Chart: Structural Strength Since 2009
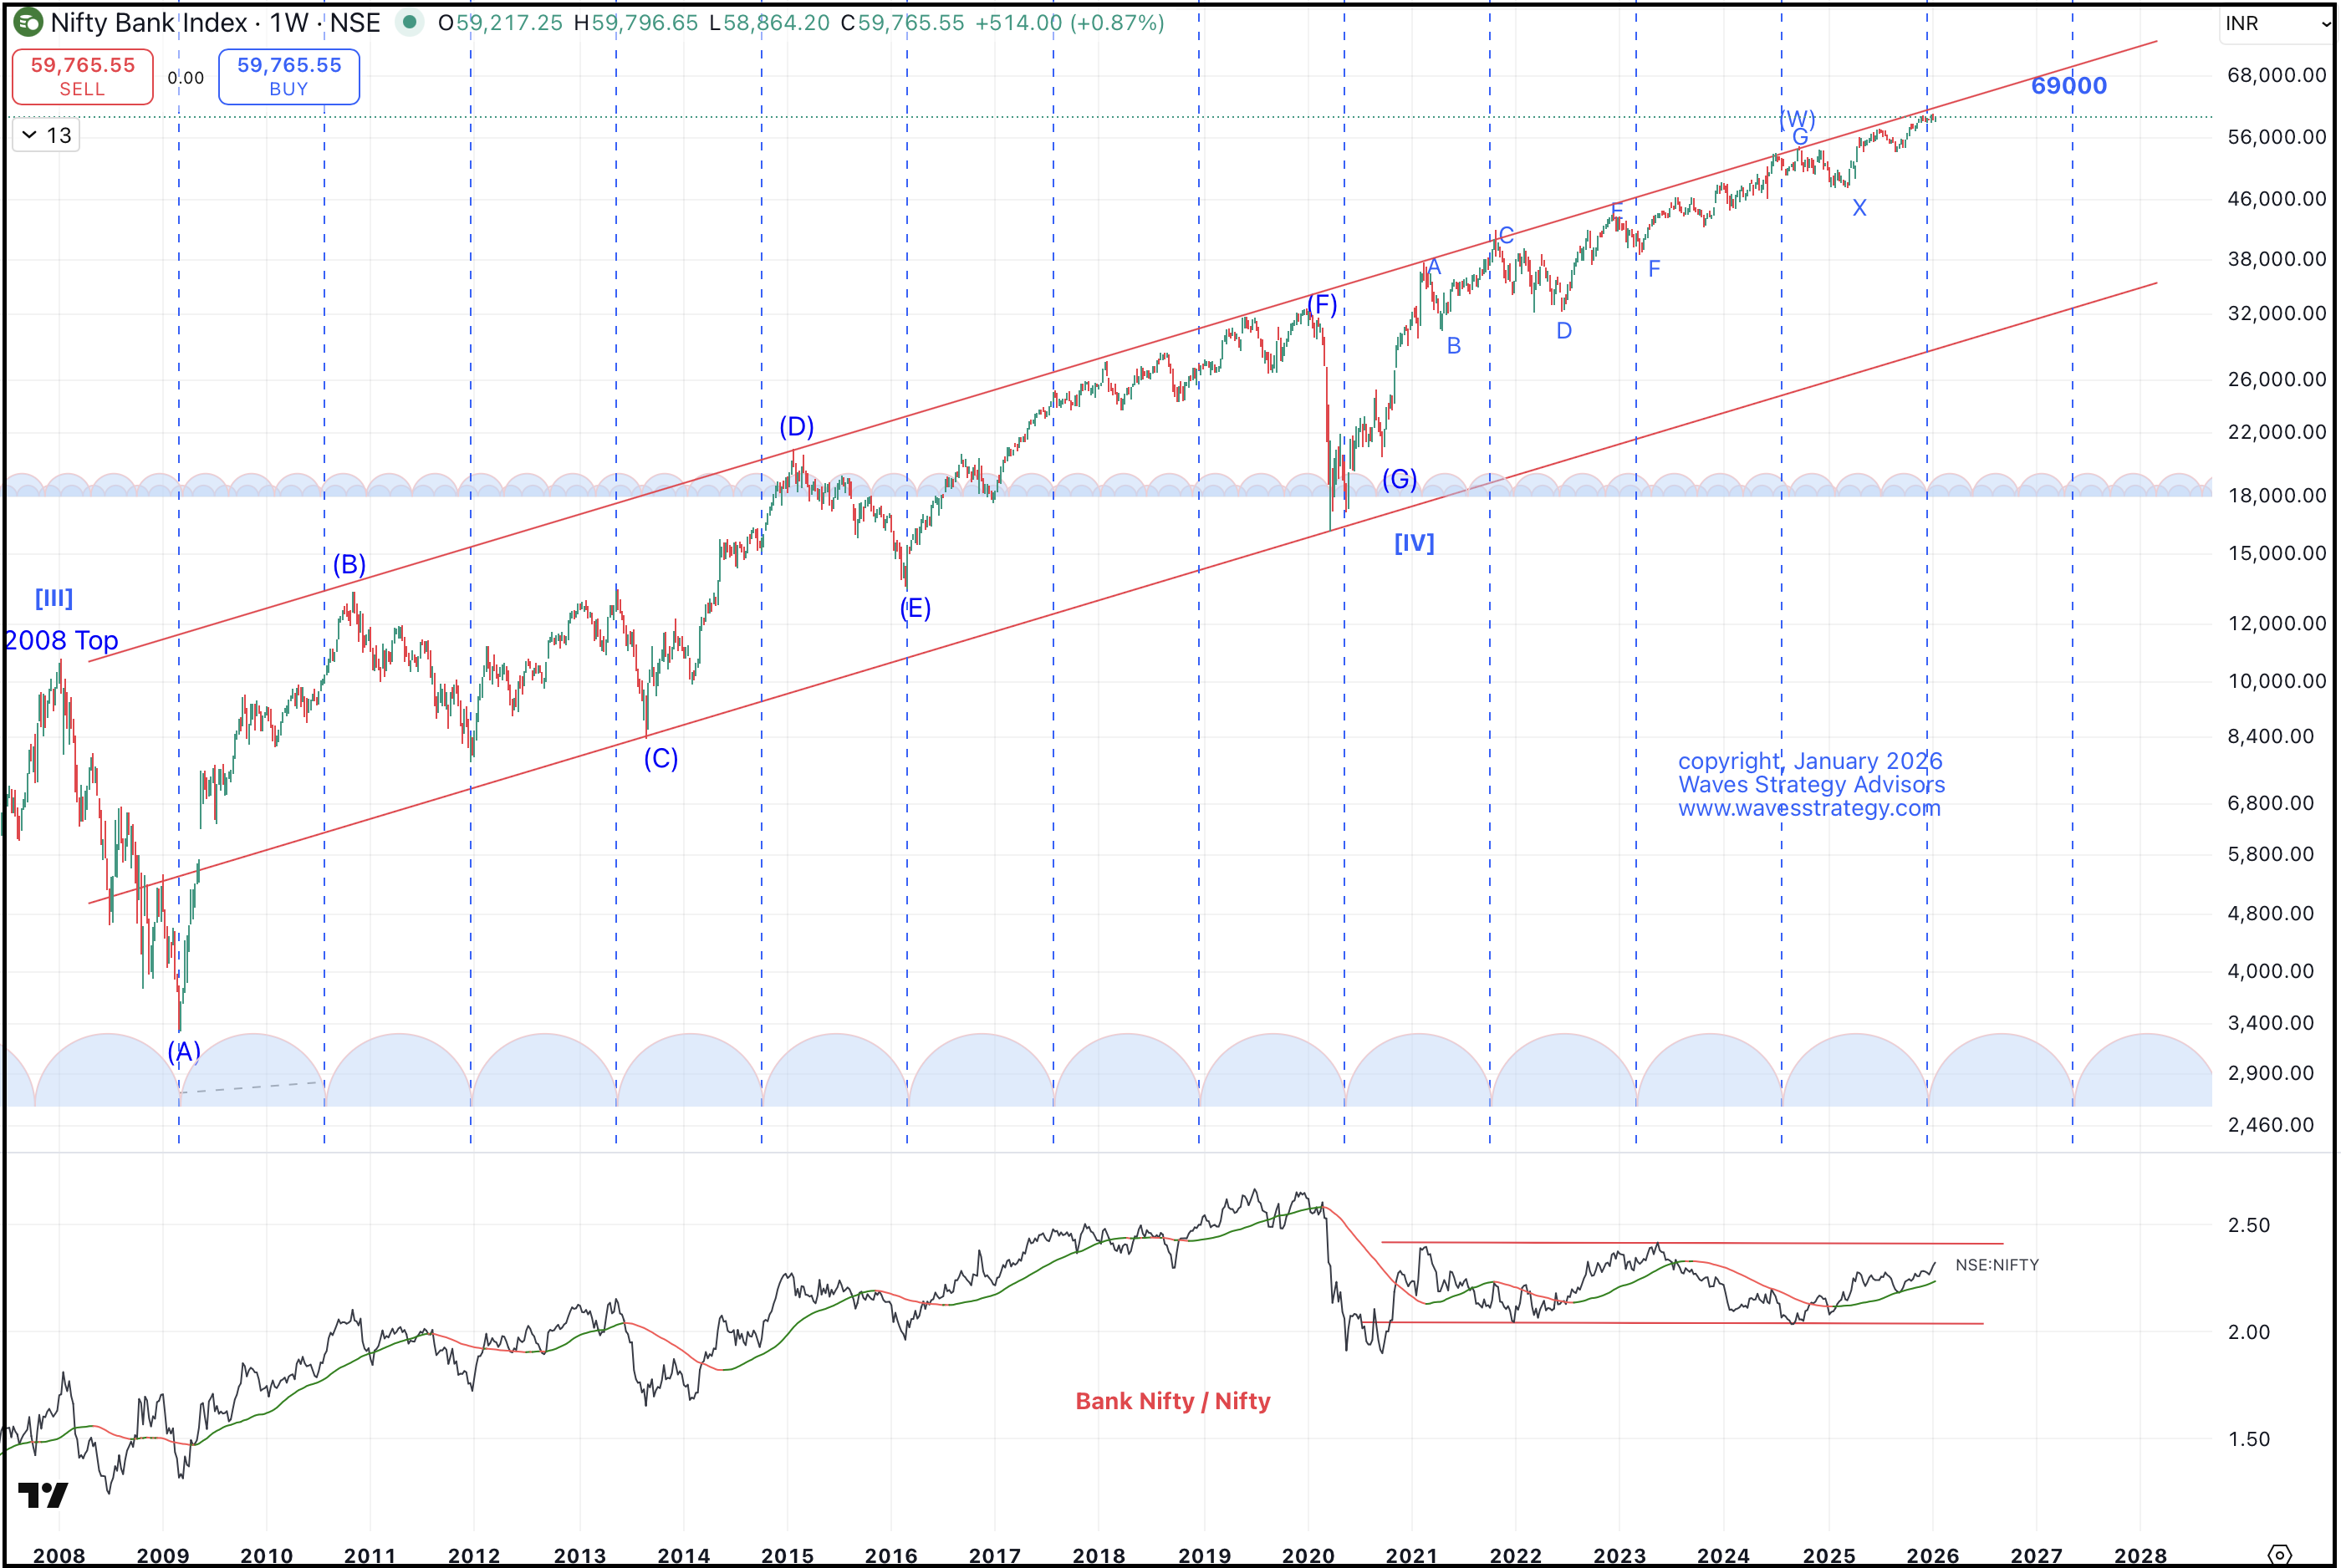
The Bank Nifty weekly chart, covering price action from the 2009 lows, shows a sustained upward structure. Since 2021, prices have remained close to the upper boundary of the long-term channel, reflecting relative strength compared to the broader market.
This behavior indicates that Bank Nifty has continued to play a leading role within Indian equity indices over the long term.
Bank Nifty vs Nifty Ratio: Relative Performance
The Bank Nifty / Nifty ratio chart provides additional confirmation of relative strength. Historically, the ratio has maintained an upward trajectory over extended periods.
This suggests:
-
Bank Nifty has tended to outperform Nifty during broader economic expansion phases
-
Relative strength remains intact on a long-term basis
-
Higher volatility has been accompanied by stronger relative returns
Time Cycle Analysis: 73-Week Cycle
One of the most critical observations is that Bank Nifty has been respecting the 73-week time cycle with remarkable precision.
- Several important market lows have formed around this cycle zone
- Each such low has historically resulted in multi-month upward moves
- Currently, prices are once again positioned right at this cycle area
This alignment reinforces the medium- to long-term bullish bias, even though short-term volatility remains possible.
Event Risk: Supreme Court Verdict and Global Market Impact
In the near term, markets may experience volatility due to the Supreme Court verdict related to the emergency declaration by Donald Trump.
- If the ruling goes against the Trump administration
- It could trigger an event shock in US markets
- Which may temporarily impact global equities, including India
Therefore, while the larger trend remains bullish, short-term corrections or heightened volatility cannot be ruled out.
Bank Nifty Outlook: Targets and Volatility
In summary:
- Medium- to long-term upside target for Bank Nifty remains at 69,000
- Short-term volatility may increase due to event risk
- Even if markets correct in the short run, the structure remains poised for eventual continuation higher
Conclusion: Power of Time Cycles and Neo Wave Analysis
This study clearly highlights how Time Cycles combined with advanced Elliott Wave Neo Wave analysis help in:
- Understanding complex chart structures
- Forecasting market behavior from short-term to long-term
- Identifying high-probability trade setups
These advanced technical tools provide traders with a classic framework for timing, structure, and trend confirmation.
Kalchakra – Bracket Master of Cycles
📅 7th & 8th February
A rare and powerful training where you will learn:
- Time forecasting along with price targets
- Advanced time cycle techniques
- Integration with Gann Square of Nine
- Sacred market science used by few
⚠️ Seats are limited
⏳ Early-bird offer ending very soon
👉 For more details, click here.
Mentorship & Training Programs
Brahmastra Mentorship: Timing the Markets
A limited-seat mentorship program focused on:
- Basics to advanced technical analysis
- Elliott Wave & Neo Wave
- Time cycles
- Stock selection algorithms
- Complete understanding of chart patterns
- Exclusive mentorship sessions
- Simple, practical trade setups that actually work
Fill below form for more details