Nifty Elliott Wave with Open Interest, Channels, Fibonacci
Jan 06, 2022
Like this Article? Share it with your friends!
Elliott wave is the GPS of the market and tells the path prices can possibly follow.
Nifty showed a sharp reversal with Gap down opening on 6th January 2022 after touching the level of 17945. This is no surprise as the indicators were overbought and so such reversals are expected on account of profit booking.
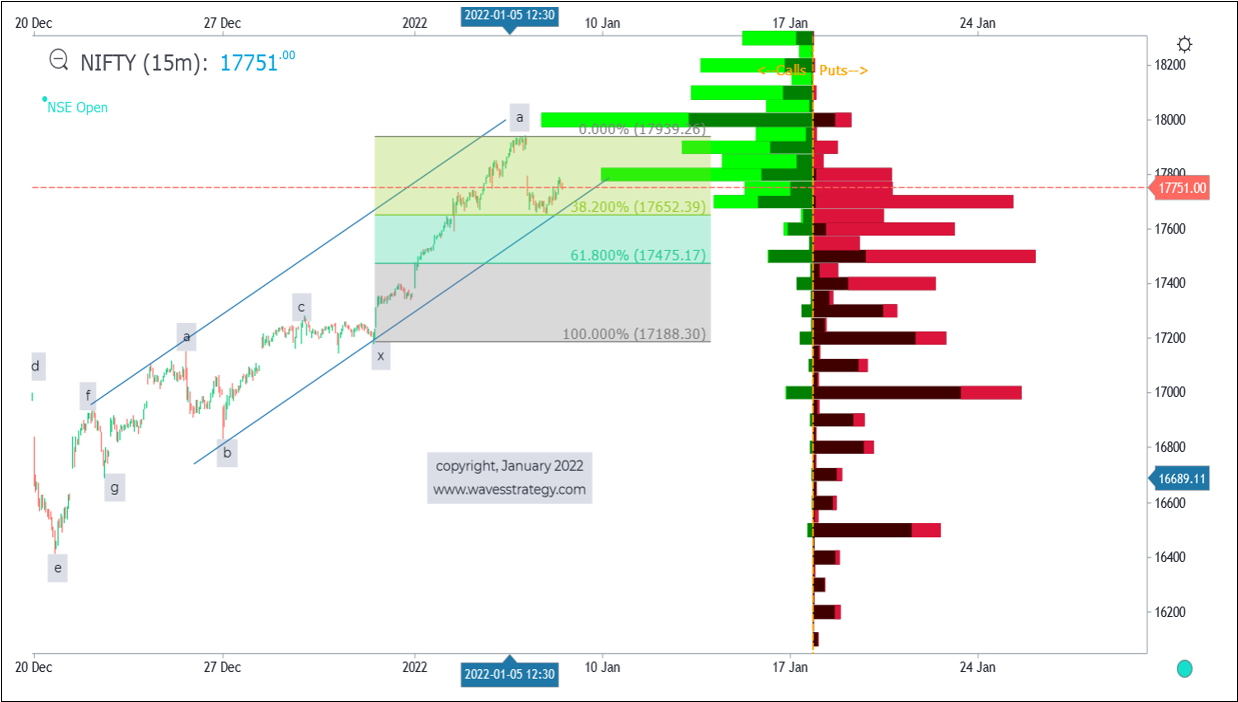
To trade it is important to understand the pattern of counter trend moves. Below chart explains the Elliott wave along with Open Interest profile.
Nifty 15 minutes chart:

Elliott wave analysis – We are showing internal counts of the rise after prices formed a low near 16410 levels. The prior downside correction got truncated in form of wave g near 16680 post which the actual up move started. The rise as per Neo wave is in corrective fashion and we are currently in wave a of second correction. This wave a completed near 17945 and now wave b is going on. The current wave b if takes more time than wave a and retraces less than 61.8% of wave a it will indicate that Zigzag pattern is under formation. On the other hand if the high of 17945 is again taken out and wave b consumes lesser time than wave a it will point towards running Diametric pattern.
It is therefore important to see the nature of wave b in order to trade the wave c and forecast what will happen few minutes, days or weeks down the line.
Open Interest profile - At the same time, Open Interest analysis is suggesting that crossing above 18k is not going to be an easy task as the call sellers are active there. With the expiry there can be reduction in the overall OI reading but still it will be significantly higher than the other strikes. On the downside 17500 put sellers are aggressively adding positions and so this will act as the support.
Fibonacci levels – 17475 is also 61.8% retracement level of the rise in form of wave a, so both OI profile and Fibonacci indicates this as an important support to prices.
Option strategy: With this understanding about the market using Elliott wave, Fibonacci and OI profile one can form option trading strategy. There is a possibility of consolidation in a range between 17945 – 17475. Giving leeway on either side in case of false moves 18050 – 17400 can be good levels for selling strangle which means selling both OTM calls and puts of respective strikes from 1 to 2 days perspective.
In a nutshell, option trading and accuracy can be at a different level once clarity on Elliott wave pattern is there which is GPS of the market.
Learn Option trading with Elliott wave, Neo Wave, Time Cycles – It is simple and easy, step by step process to learn these techniques and we will ensure you are able to apply it. Register for 15th – 16th January 2022 Live Event to learn these methods and see the difference in your trading ability, accuracy, consistency. It will change the way you see the markets. Know more here
