Is the correction in Nifty over? This is what Neo wave has to say above it..
Dec 30, 2021
Like this Article? Share it with your friends!
Is the correction in Nifty over? This is what Neo wave has to say above it.
After about 10% correction from the lifetime high in Nifty, the index is now recovering. Neo waves can tell if the correction is over and the uptrend has started again. Checkout the research below to know where the index is headed over the short term.
We published the following report today morning in “The Financial Waves short term update “
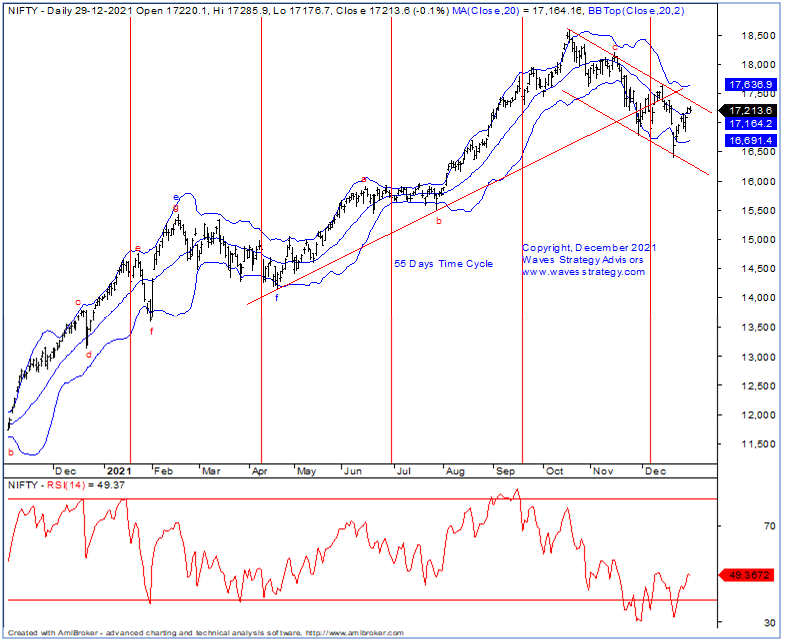
Nifty Daily chart: (As of 29th December 2021)
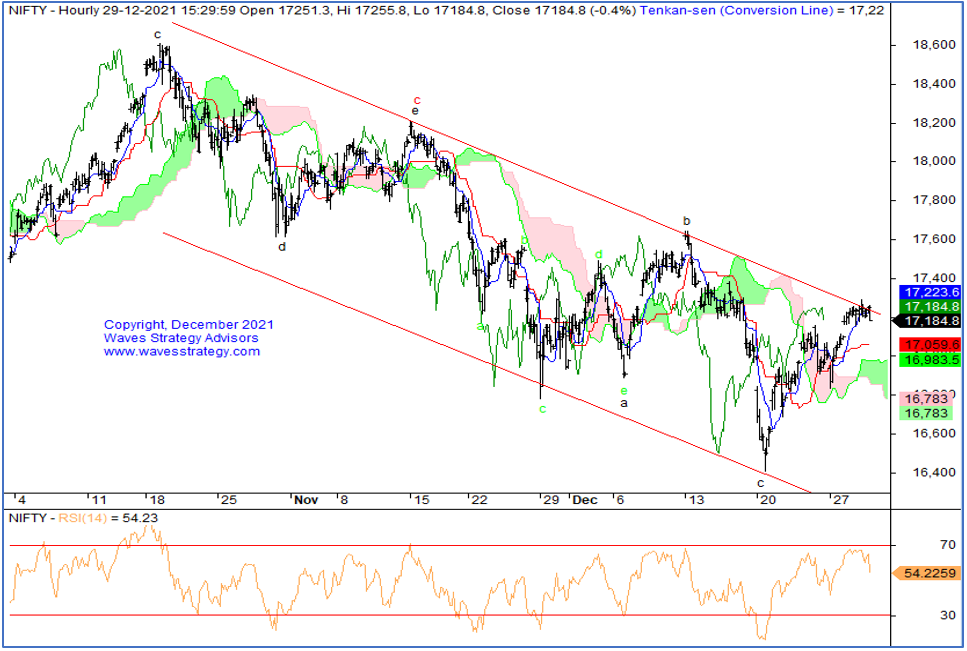
Nifty 60 mins chart: (As of 29th December 2021)
Wave analysis:
The above daily chart shows that from the lows of 16410 levels, prices have been on short-term rise which has managed to break above the middle Bollinger bands. However, in the past occasion, we saw that it failed to sustain above the bands for more than 2 trading sessions and reversed on the downside. Thus, today’s session is going to be important from this perspective. Last session's price action has resulted in the formation of a small Doji candlestick pattern which often hints towards the halt or reversal. This we will come to know based on follow up action in today’s session. Any close below the 17100 level will fill the short-term gap area and suggest towards negativity. Unless this happens, the upward trend can continue with momentum to keep a close track with 17300-17350 as a crucial resistance zone.
The volume activity has reduced over the last few days on the back of the holiday season which is also known as the December effect as during these times FII’s remains absent. Thus, there is also a possibility that we might see a choppy kind of trading environment over the next few days.
As shown in 60 mins chart, we continue to see the recent rise from the lows in form of minute wave d of the Diametric pattern which has reached towards the channel resistance. From here on, any move below 17100 followed by 16830 level will suggest that next leg on downside has started in form of a minute wave e. On the higher side, zone of 17300-17350 is the important one.
In short, Nifty has continued to trade with a positive bias over the last few sessions however it has reached towards crucial juncture. Thus, one should adopt a cautious approach. On the upside 17300-17350 is the resistance whereas on the downside close below 17100 will provide the first negative sign.
Festive Special Offer - Get access to the Monthly research consisting of applications on charts and how you can ride the trend using simple powerful Wave theory, Act NOW! Subscribe here
Master of Waves – Learn complete Elliott wave, Neo wave along with Time Cycles and equip with excellent trade setups for trading Intraday and positional along with forecasting the markets from very hour, day and months. 2 Days of Live event on 15th – 16th January 2022, Know more here