Nifty Options Trading Using Time cycles on 15 minutes chart!
Jan 22, 2026
Options Trading requires an understanding of momentum and time. If one is missed, making money becomes a lot more difficult.
It is possible to time the entry by applying Time cycles directly on the options chart.
Nifty 25000 Put Options chart with Time cycle
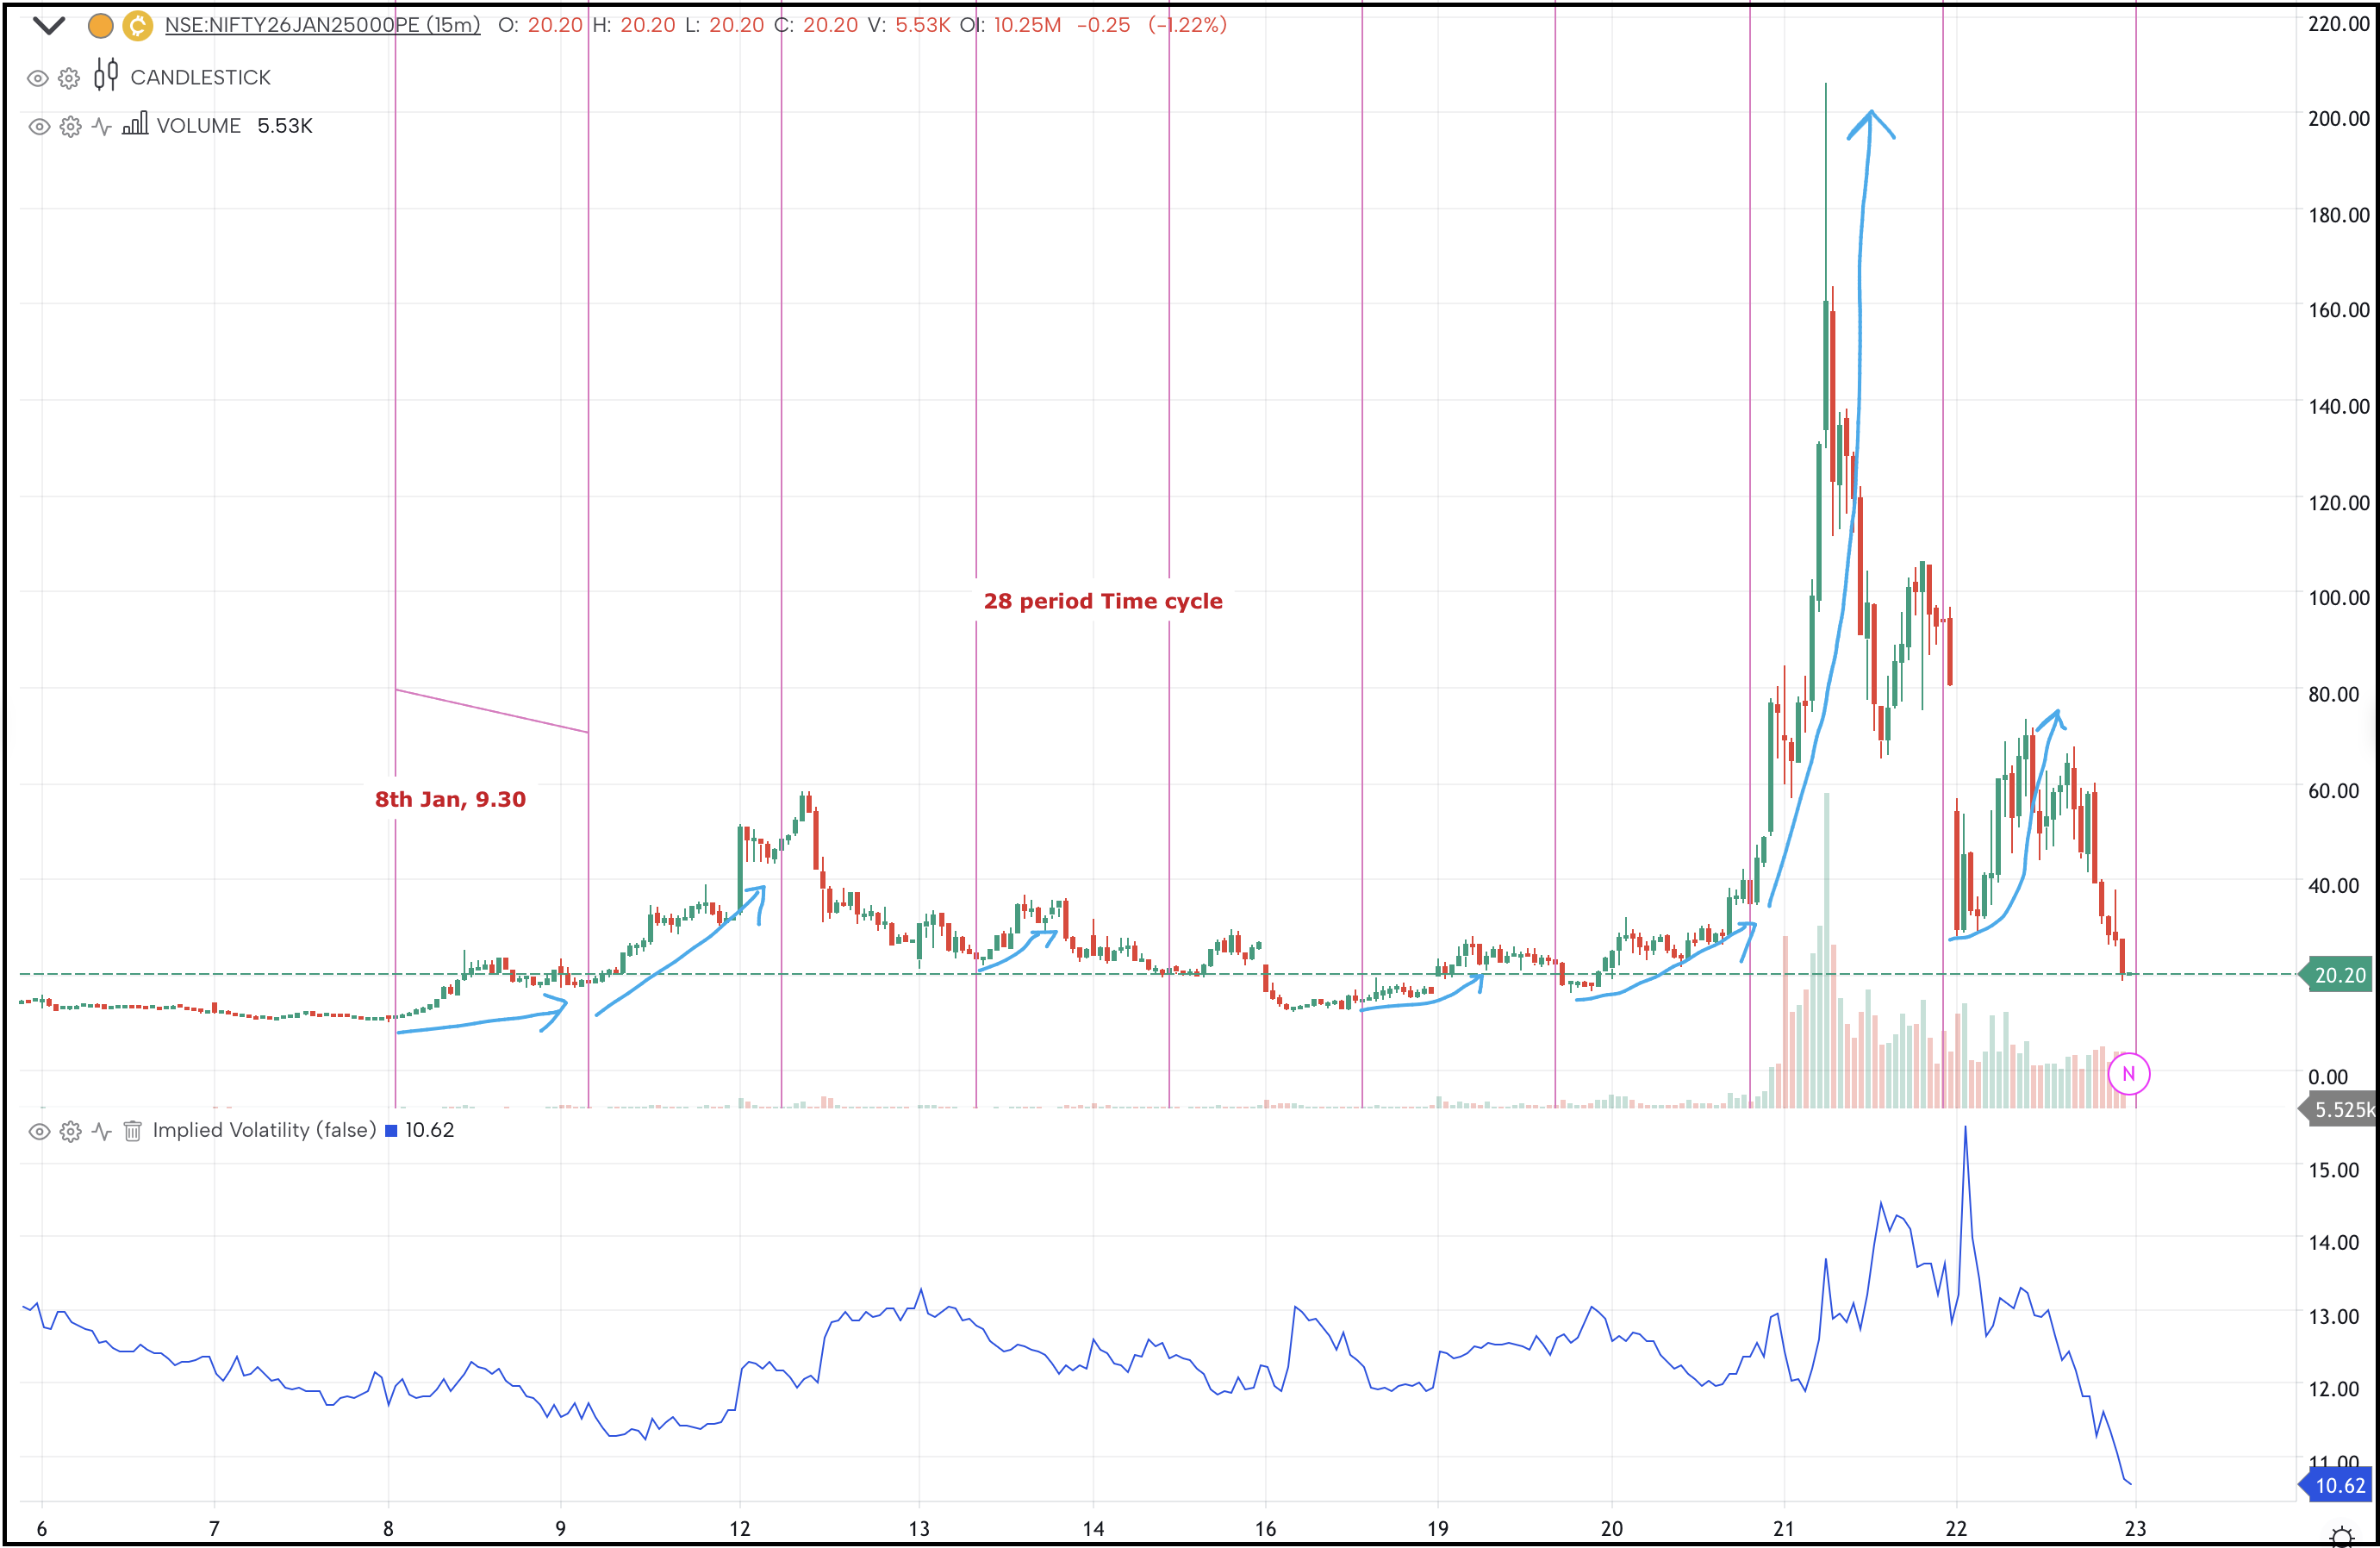
Time cycles can be applied directly on Options chart as well to identify the areas of reversal. Price action combined with Time cycle is a lethal combination for Options Traders
The above chart shows 28 period of the time cycle applied on 15 mins chart of 25000 put options. Prices have been giving strong positive reversals from this cycle period.
As shown in above chart, everytime prices approach near this time cycle and exhibits positive price action it provides buying opportunity for a move on upside.
There was a sharp move from 40 to above 200 levels in just few hours of the cycle period.
In a nutshell, Time cycle can be the missing element in your trading that can make a difference especially for Options traders and when volatility is only increasing. Prices are again approaching this cycle period and a positive price action near it will be another opportunity as well. Only a few understand the science of time and knows how to trade it correctly. We call these traders as “Time Traders”
Kaal Chakra – Master of cycles: Be a part of elite trading community who trades time by combining the concepts of Hurst’s Time cycles along with Gann square of 9. Live sessions on 7th – 8th February, Application of time trading, deriving targets using time, stoploss management with list of stocks along with time period. Act now, Limited seats only – know more
3 months of Mentorship (Brahmastra) on Timing the Market – Apply Time cycles with Elliott wave, Neo wave, stock selection, risk management strategy, exclusive mentorship sessions & trade like a pro. Limited seats, Fill below form for more details