Nifty Power of Fractal Nature! Crash and the Rise
Dec 30, 2020We believe in the theory that freely traded markets are patterned and exhibits fractal nature.
This makes them behave in a predictable manner. By pattern we mean that there are certain structures that repeat itself from time to time and can be seen on charts that shows prices of any tradable instrument. The “Fractal Nature” is again an important concept which states that these repeatable patterns occur on varied time scales and can be seen on 1 minute charts to Daily charts to Monthly charts. Fractal structure is seen in nature across from DNA to snowflakes to galaxies and so it is also seen in stock markets which reflect collective emotions and social mood of humans.
Can you Spot the difference?
Nifty weekly chart – Crash of March 2020 and the Rise

Nifty hourly chart – Crash of 21st December 2020 and the Rise
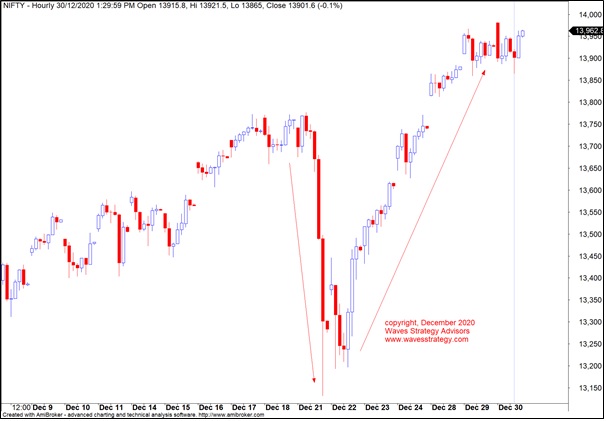
The first chart is of Nifty on Weekly time scale. It shows the crash seen during February to March 2020. The second chart is also of Nifty but Hourly time scale that exhibits the crash seen on 21st December 2020 and the rise followed after it.
Both of the above charts clearly shows the sharp decline in just 3 to 4 candles followed by the subsequent rise that took out the earlier highs. This simply shows that patterns are repeatable across the time frames and technical analysis can be applied right from the tick chart to the annual charts. Speed of execution and an eye for patterns is the key in order to make money by using Fractals.
It is for this reason why on 22nd December we turned bullish again post the sharp decline and expected markets to start moving higher which it did exactly as expected. The same was also mentioned in the morning daily research report – The Financial waves short term update and it helped us to give positional buy call as well on Nifty.
The above clearly shows that irrespective of the events markets are exhibiting patterned behaviour across the time frames which are nothing but a fractal nature working across the universe.
So, how does it help in trading?
Elliott wave and Neo wave are based on this basis premise that the patterns that are working on a tick chart are also working on the bigger time frames. In addition to this by combining Fibonacci ratios and projection one can at times predict the exact turn. By knowing fractal nature one can know what to expect next and how prices will behave. News or events will only clutter the reasoning but what works is the ability to decipher the chart.
Get access to positional and intraday calls on Nifty, Bank Nifty, Stocks, Commodity along with Momentum calls and Multibagger stocks that will outperform from here on – Check here
Learn the Power of Fractal and equip yourself with forecasting tools using Elliott Wave, Neo wave, Hurst’s Time cycles. Register for Master of Waves program now as only limited seats and Early Bird Ends on 5th January 2020 – know more