Nifty scenario analysis – Applying Bollinger Bands® and Elliott Wave theory
Mar 31, 2020RBI cut interest rates by 75 bps to 4.4% on 27th March. This is a huge slash. They also reduced reverse repo by 90 bps and CRR by 100 bps. This clearly suggest desperate attempt to stabilize the economy by boosting the liquidity in the system. Also Moody’s has cut India’s growth forecast to 2.5%. All of this has come as a lagging action post the stock market collapse. Nifty entered negative territory after the event but managed to close minor positive.
We are not saying this is not a good step but it only reflects how vulnerable the entire economy is as of now. That is the reason we say that government actions are lagging the freely traded markets.
You can subscribe to my YouTue channel to get latest webinar alerts. See over here Nifty crash comparable to 1987 and not 2008
We have been vocal through our weekly Friday webinar videos since past many weeks about the impending Bear market and the stand has been vindicated so far. To see the past few webinars simply visit the Elliott wave channel over here
Following research was published on 30th March 2020 when Nifty was trading near 8600 levels!
Nifty hourly chart: (shown on 30th March 2020) morning before markets opened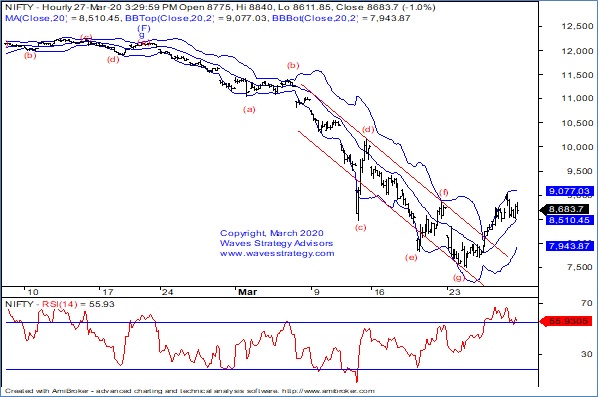
Wave analysis:
We can see that Nifty gapped up but formed a bearish candle on Friday. Although the crucial 8883 resistance level is taken out during intraday, price did not manage to close above it, hence this zone between 8890-9040 could as a resistance zone. Now break below the low of 8500 will resume the trend back towards 8100 – 8000 levels. There is a minor topping Head & Shoulder on short term charts and 8500 will also breach the average within the Bollinger Bands.
On the hourly chart we can see the fall in form of Diametric is complete and we are seeing a pullback either in form of wave x or minor wave a. Move below 8500 will suggest start of wave c lower back towards ….. levels. It is best to keep looking at sell on rise market unless we see break back above …… near upper end of the Bollinger Bands.
In a nutshell, Nifty is at crucial juncture now. We expect range bound price movement between 9050-8000.
The above clearly shows how one can capitalize in the ongoing movement on markets by understanding the Elliott wave patterns and combining with many other technical tools.
So, to see the levels from here on and how to trade this bear market simply get access to the daily short term research report – “The Financial Waves short term update”. Over here
Most advanced Technical analysis Training ONLINE for the first time. Learn Elliott wave, Neo wave, Hurst’s Time cycles. The early bird ends on 5th April 2020. Know more over here